by
Robert Gibboni
The challenge
The objective of the VisioMel Challenge was to explore the feasibility of an algorithm that can predict the recurrence of melanomas diagnosed at a localized stage. The results already show that the algorithms are at least on par with the traditional prognostic factors. In the near future, it will undoubtedly be possible to have a predictive digital signature of melanoma recurrence. This type of signature should make it possible to offer adjuvant treatment only to patients who would benefit from it.
Frédéric Staroz, President of the Conseil National Professionnel des Pathologistes (CNPath)
Motivation
Melanoma is a cancer of the skin which develops from cells responsible for skin pigmentation. In 2020, over 325,000 people were diagnosed with skin melanoma, with 57,000 deaths in the same year.1 Melanomas represent 10% of all skin cancers and are the most dangerous due to high likelihood of metastasizing (spreading).2
Patients are initially diagnosed with melanoma after a pathologist examines a portion of the cancerous tissue under a microscope. At this stage, the pathologist assesses the risk of relapse—a return of cancerous cells after the melanoma has been treated—based on information such as the thickness of the tumor and the presence of an ulceration. Combined with factors such as age, sex, and medical history of the patient, these microscopic observations can help a dermatologist assess the severity of the disease and determine appropriate surgical and medical treatment. Preventative treatments can be administered to patients with high likelihood for relapse. However, these are costly and expose patients to significant drug toxicity.
Assessing the risk of relapse therefore a vital but difficult task. It requires specialized training and careful examination of microscopic tissue. Currently, machine learning approaches can help analyze whole slide images (WSIs) for basic tasks like measuring area. However, computer vision has also shown some potential in classifying tumor subtypes, and in time may serve as a powerful tool to aid pathologists in making the most accurate diagnosis and prognosis. 3, 4, 5
Results
The goal in this challenge was to predict whether a relapse will occur in the 5 years following the initial diagnosis using digitized versions of microscopic slides and tabular clinical features. For each slide, participants had to predict a score between 0 and 1 indicating the likelihood of relapse.
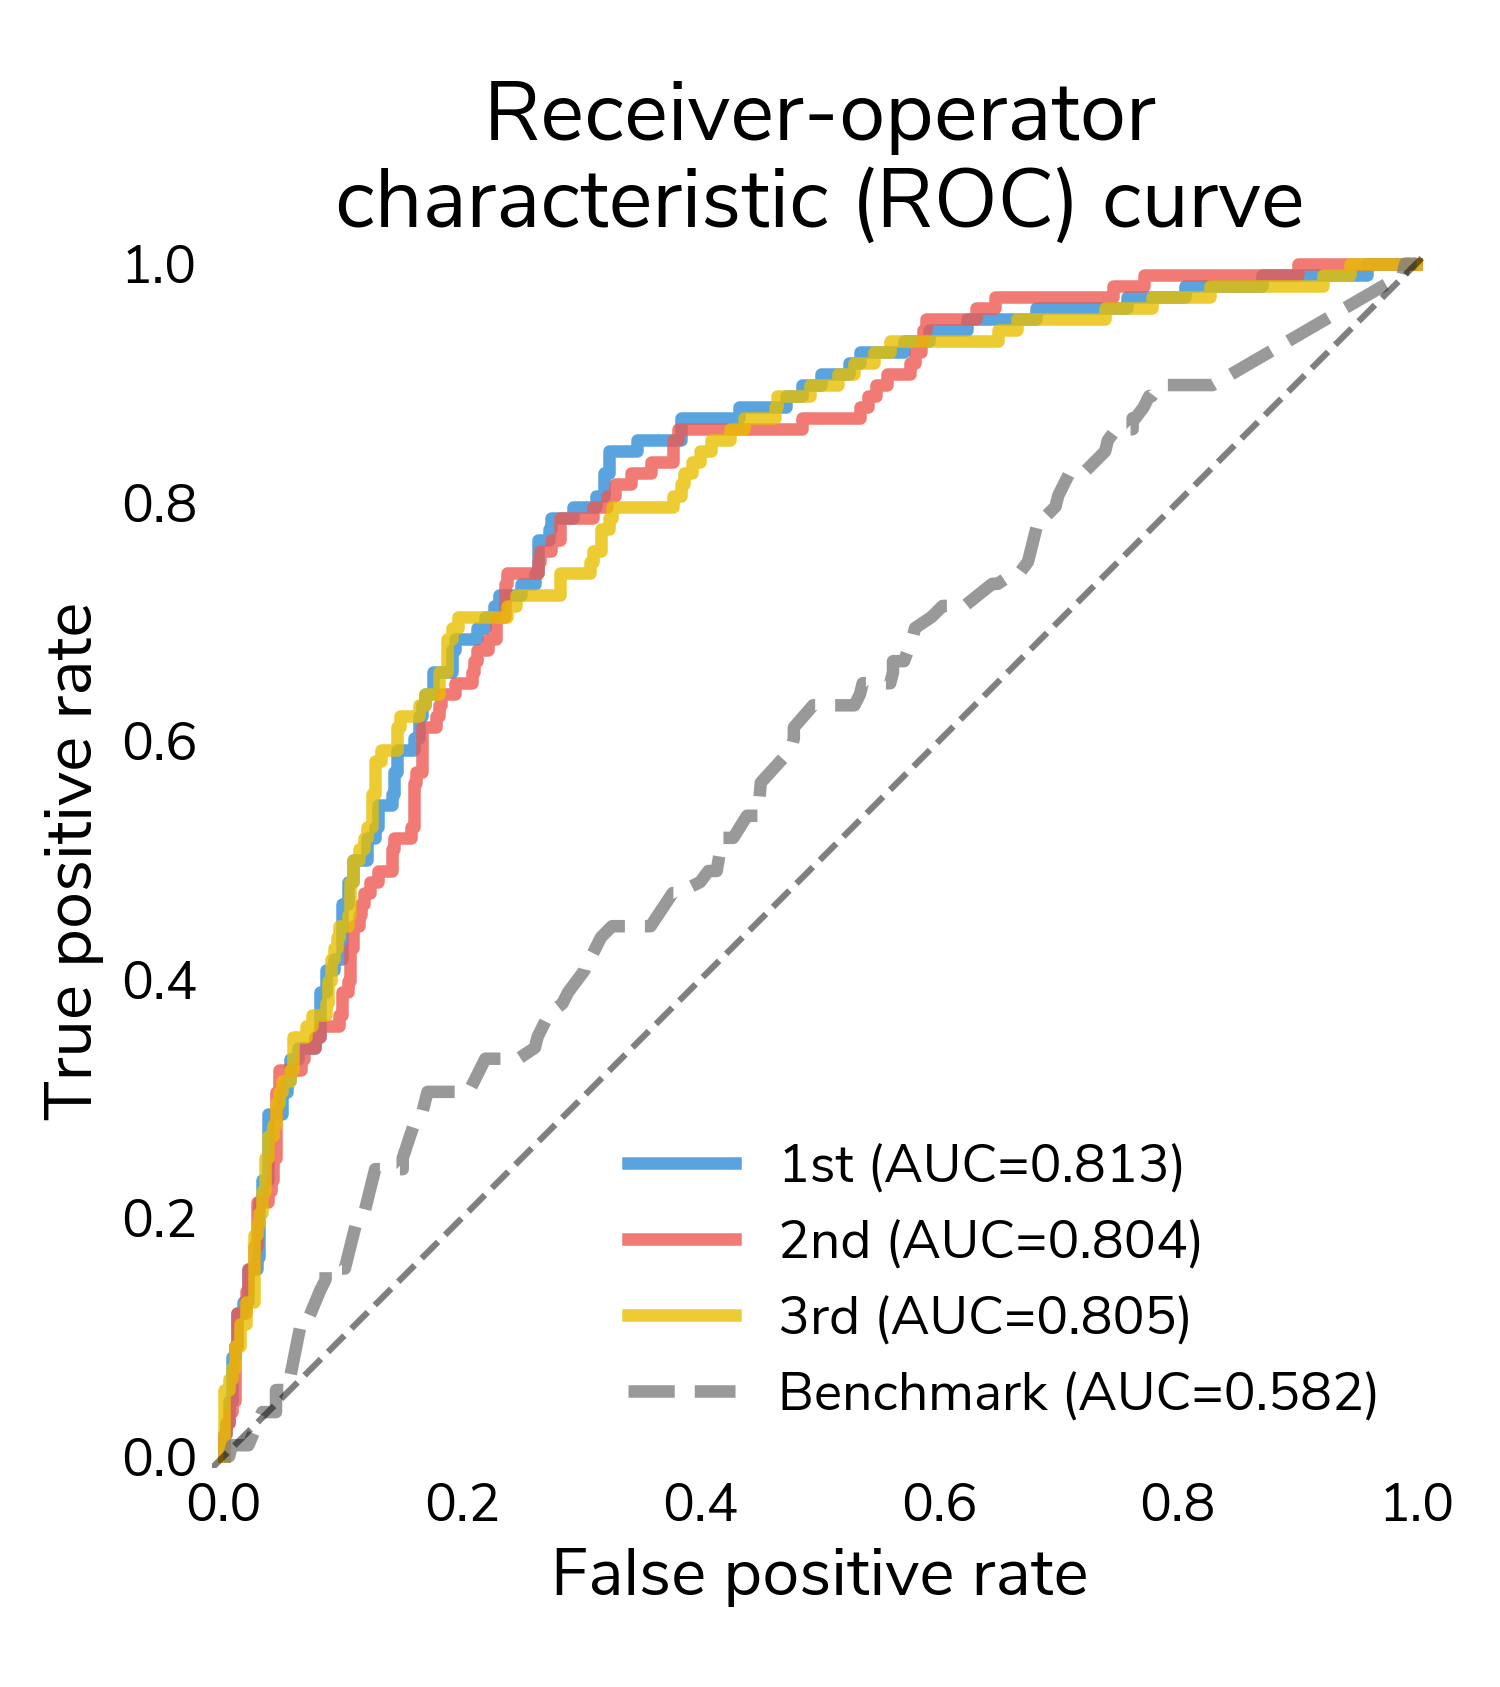
The receiver-operating characteristic (ROC) curve is a good place to start understanding performance. It shows false positive rate (proportion of "no relapse" cases for which a model predicts relapse) and true positive rate (proportion of relapses for which a model correctly predict relapse) at different classification thresholds. At the highest thresholds (lower left), true positives increase quickly while false positives stay relatively constant. In this regime, all three winners mostly correctly classify these easier relapse cases. Moving to the right, performance starts to diverge as we get to more difficult cases. Decreasing the threshold detects more relapses and also results in more false positives. A good performing model will push the ROC curve towards the upper left hand corner, maximizing the area under the curve (AUC), which varies between 0.5 (random guessing) and 1 (perfect classification). All three winners substantially outperform the challenge benchmark model that only incorporates the tabular clinical features.
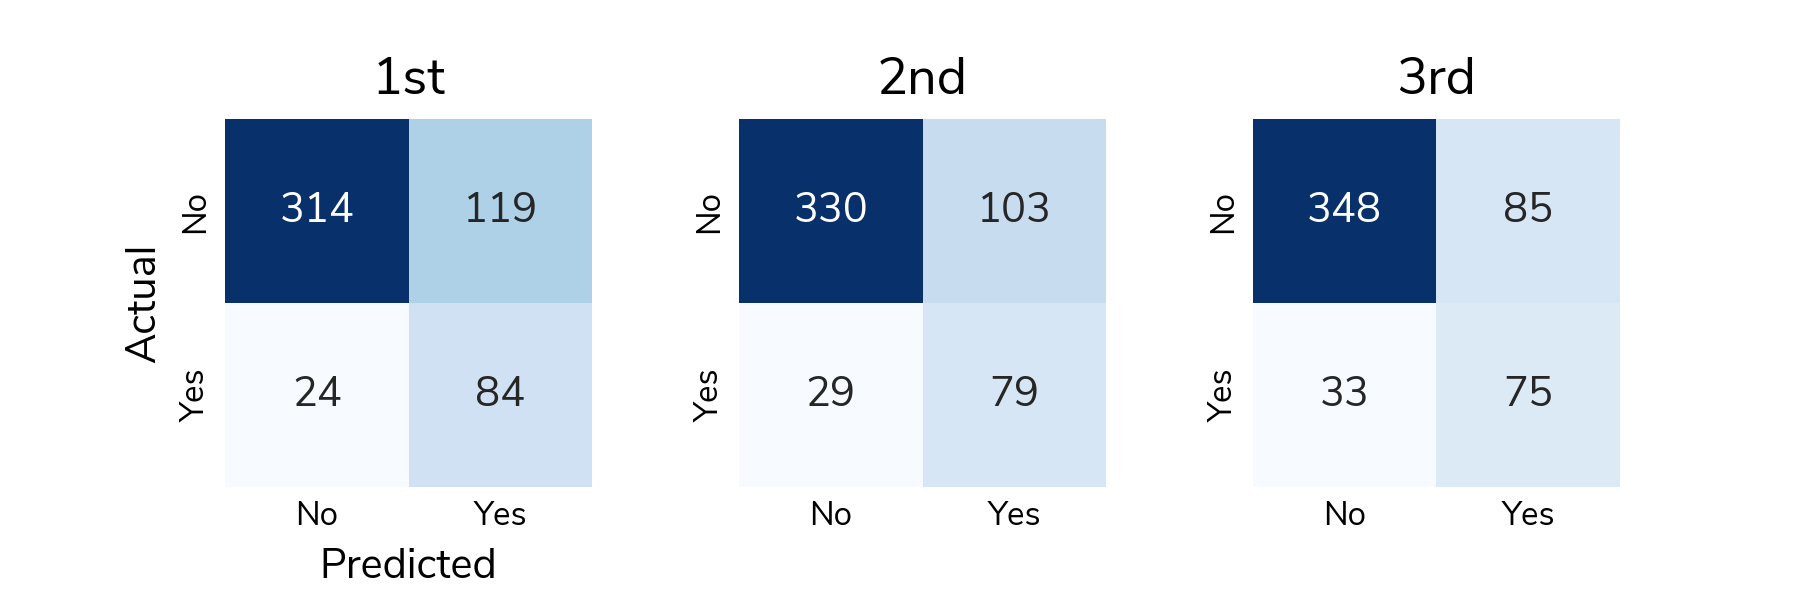
ROC is great for understanding how the predicted scores differentiate positive and negative samples across all thresholds, but to actually classify a sample, we need to select a classification threshold. This is a challenging topic in its own right, but for this post, we chose the threshold that jointly optimizes true positive and false positive rates. Now we can look at a confusion matrix showing the number of different types of successes and errors. The raw counts highlight the class imbalance in the data; there are far more "no relapse" cases than relapses.
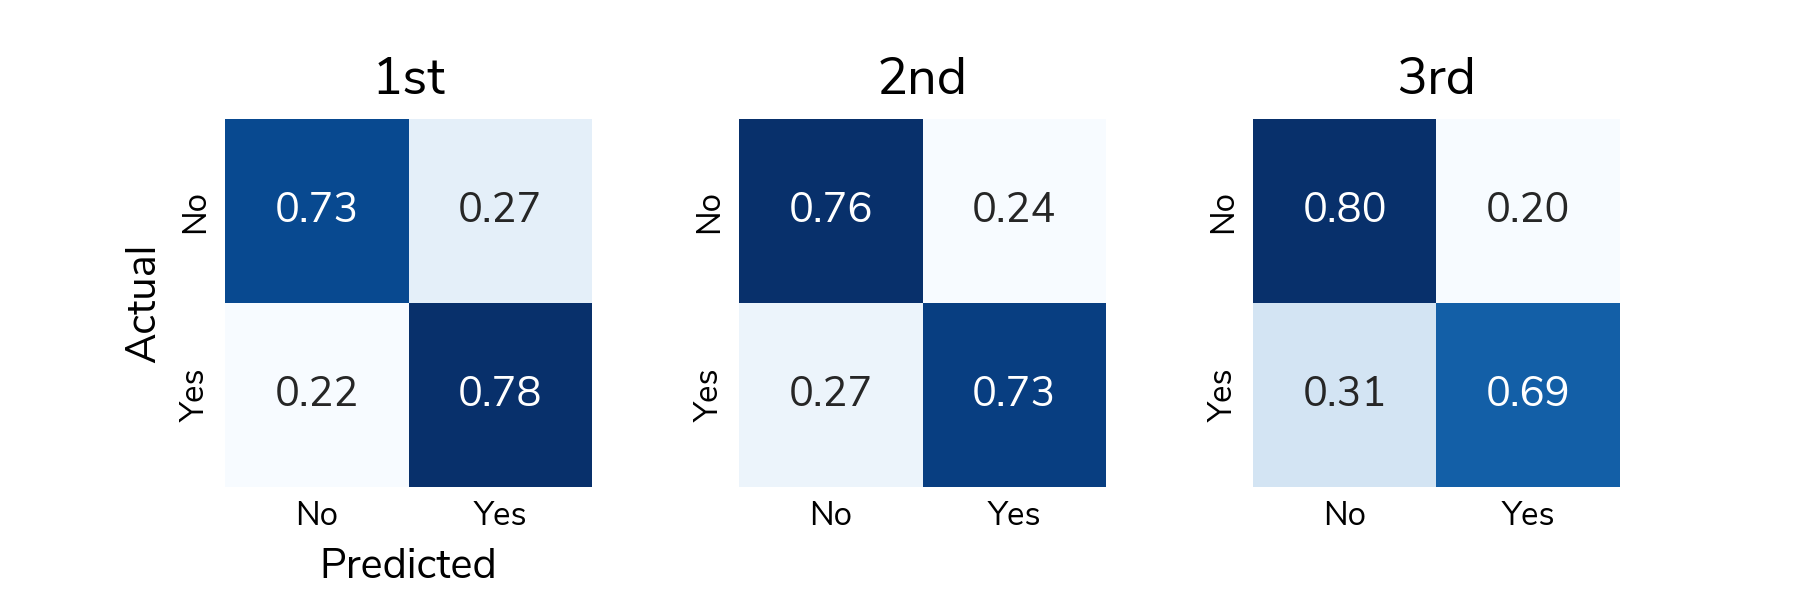
To understand detection rates, we normalize the confusion matrix so that each cell shows the proportion of actual relapse/no relapse cases that were classified correctly/incorrectly. The bottom right cell (Actual: Yes / Predicted: Yes) shows the true positive rate or the proportion of relapses that were correctly detected. The top left cell (Actual: No / Predicted: No) shows the true negative rate or the proportion of "no relapse" cases that were correctly classified as no relapse. On average, solutions correctly detected around 73% of relapses in the test set and correctly identified around 75% of "no relapse" cases.
All the prize-winning solutions from this competition are linked below and made available for anyone to use and learn from. Now let's meet the winners and learn how they approached this problem!
Meet the winners
Raphael Kiminya

Place: 1st
Prize: €12,000
Hometown: Meru, Kenya
Username: karelds
Background:
I’m a freelance data scientist. I regularly participate in data competitions, particularly those focussed on solving problems of significant social impact.
What motivated you to compete in this challenge?
In 2020, I participated in the TissueNet competition hosted on DrivenData and the PANDA challenge on Kaggle. I saw this challenge as an opportunity to expand on my previous work and make a meaningful contribution to cancer research.
Summary of approach:
I pre-trained a convolutional neural network (CNN) model with breslow/ulceration as the target variables and then fine-tuned with relapse as the target. The idea was to help the model learn relevant features from the initial task and transfer that knowledge to relapse prediction.
Building upon recent digital pathology research in Whole Slide Images (WSI) classification, I framed the problem as a Multiple Instance Learning (MIL) task. This involves dividing each WSI into smaller patches, processing them individually with a CNN feature extractor, and aggregating the extracted features to classify the entire WSI.
To extract tiles from the WSIs, I used the same code that I had previously used in the TissueNet competition. This effectively filters out low quality tiles, ensuring that only the most useful tiles in the WSI are selected for further processing. Even with this tile filtering step, most slides had thousands of potentially useful tiles, but training on approximately 1 million images was not computationally feasible. To address this, I opted to use a pretrained model to extract features from the tiles. The extracted embeddings were then used to train a MIL model on breslow/ ulceration prediction tasks. This method retained an adequate level of representational power while overcoming the computational limitation of training on a large number of images.
I used the SparseConvMIL architecture, which employs sparse convolutions to preserve the spatial relationship of the tiles. The idea was to preserve structures across multiple tiles that might be useful in identifying ulcerations or calculating breslow.
Finally, out-of-fold predictions for breslow and ulceration were generated and, together with the patient's metadata, used to train an MLP model. My best solution was a mean ensemble of two MIL/MLP models trained with tiles extracted from pages 2 and 3 of the WSI, and two CNN models trained on the full slides at different sizes.
Check out karelds's full write-up and solution in the competition repo.
Lucas Robinet & Ziad Kheil (Tilted Towers)

|
Place: 2nd
Prize: €8,000
Hometown: Toulouse, France
Username: lucas.robinet & Kheil-Z
Background:
Lucas Robinet: I am in my first year of doctoral studies in Toulouse at the CRCT and the IRT Saint-Exupéry. My topic is the multimodal analysis of cancer patients' data and more specifically of glioblastoma data using deep learning.
Ziad Kheil: Currently a PhD student at the CRCT, I work on deep learning based medical image registration with a focus on thoracic images. Particularly in the case of 4D-CT phase registration, as well as multi-modal image registration.
What motivated you to compete in this challenge?
The multimodal aspect of the task, but also and above all the idea of being able to manipulate WSI and the resulting challenges.
Summary of approach:
We trained a ResNet to predict relapse, ulceration and breslow on low resolution images. Then concatenate the imagery embedding with a clinical embedding, obtained from dense layers. We used a focal loss to handle class imbalance and help the model learn on difficult examples that are often present in WSI.
Check out Tilted Tower's full write-up and solution in the competition repo.
Tristan Lazard
Place: 3rd
Prize: €5,000
Hometown: Paris, France
Username: trislaz (GitHub, Twitter)
Background:
I am finishing my PhD in computational pathology in Mines-Paristech and Institut Curie under the supervision of Thomas Walter and Etienne Decencière. I worked on the prediction of homologous recombination deficiency in breast cancer from histopathological images, and on the technical side I focused on the different supervision regimes for deep learning models in the context of histopathological images (for example with this work, or this one).
What motivated you to compete in this challenge?
I aimed to test the algorithm I developed over the past year, which is a fully self-supervised method for training whole slide image (WSI) representations.
Summary of approach:
I primarily followed the same approach as outlined in the Giga-SSL paper, but with some adjustments:
-
Due to specific Docker installation issues, I could not use the sparse-CNN aggregator. Instead, I employed a spatially-unaware architecture consisting of residual fully connected blocks.
-
Given the high amount of normal dermal or epidermal tissue and back- ground in the WSIs, I manually labeled a few patches to train a binary classifier for detecting them. This classifier was then used to filter out irrelevant patches for the task.
After encoding with the Giga-SSL pre-trained models, we obtained a 256- dimensional feature vector for each WSI. These L2-normalized embeddings were directly used to train L2-regularized logistic regression models in a 40-fold cross-validation scheme, which served as the classification models for the challenge.
Check out trislaz's full write-up and solution in the competition repo.
Thanks to all the participants and to our winners! Special thanks to VisioMel and the Health Data Hub for enabling this fascinating challenge and for providing the data to make it possible!