TissueNet: Detect Lesions in Cervical Biopsies
The French Society of Pathology and the Health Data Hub are very enthusiastic about the data challenge results! They show that AI will sooner or later be part of the tools that pathologists use on a daily basis. Of course, there is still a lot to do to validate these approaches in the professional environment. This data challenge on epithelial uterine cervix lesions along with data challenges for other pathology domains paves the way for another set of challenges, the true life validation challenges.
Dr. Philippe Bertheau, President of the French Society of Pathology
A biopsy is a sample of tissue examined at a microscopic level to diagnose cancer or signs of pre-cancer. While most diagnoses are still made with photonic microscopes, digital pathology has developed considerably over the past decade as it has become possible to digitize slides into "virtual slides" or "whole slide images" (WSIs). These heavy image files contain all the information required to diagnose lesions as malignant or benign.
Making this diagnosis is no easy task. It requires specialized training and careful examination of microscopic tissue. Approaches in machine learning are already able to help analyze WSIs by measuring or counting areas of the image under a pathologist's supervision. In addition, computer vision has shown some potential to classify tumor subtypes, and in time may offer a powerful tool to aid pathologists in making the most accurate diagnoses.
This challenge focuses on epithelial lesions of the uterine cervix and features a unique collection of thousands of WSIs collected from medical centers across France. The lesions in slides like these are most often benign (class 0), but others have low malignant potential (class 1) or high malignant potential (class 2), and others may already be invasive cancers (class 3). The objective of this competition was to detect the most severe epithelial lesions of the uterine cervix present in these biopsy images.
One of the interesting challenges for this competition was to design a metric that expressed how pathologists think about the risks of different types of misclassifications. We know that it is worse to mistake normal tissue for high malignant potential (class 2) tissue than to mistake it for low malignant potential (class 1) tissue―but how much worse? Our partners at the French Society of Pathology worked with domain experts to arrive at a consensus about how to quantify these intuitions. (Mistaking a class 0 lesion for a class 2 lesion is 7x worse than mistaking it for a class 1 lesion.) The competition used this quantitative consensus to evaluate all submissions and select the winners. (Read more about the custom metric in the competition's Problem description.)
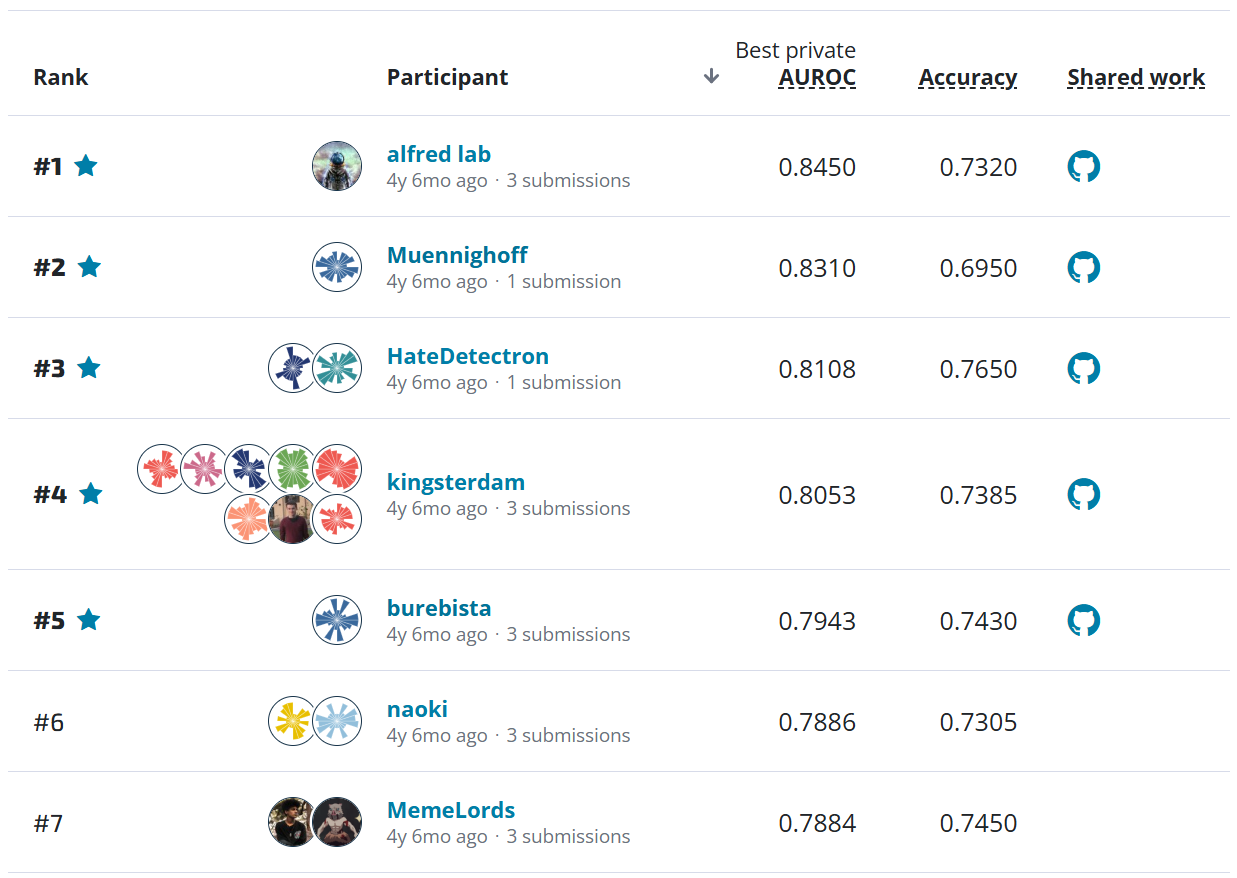
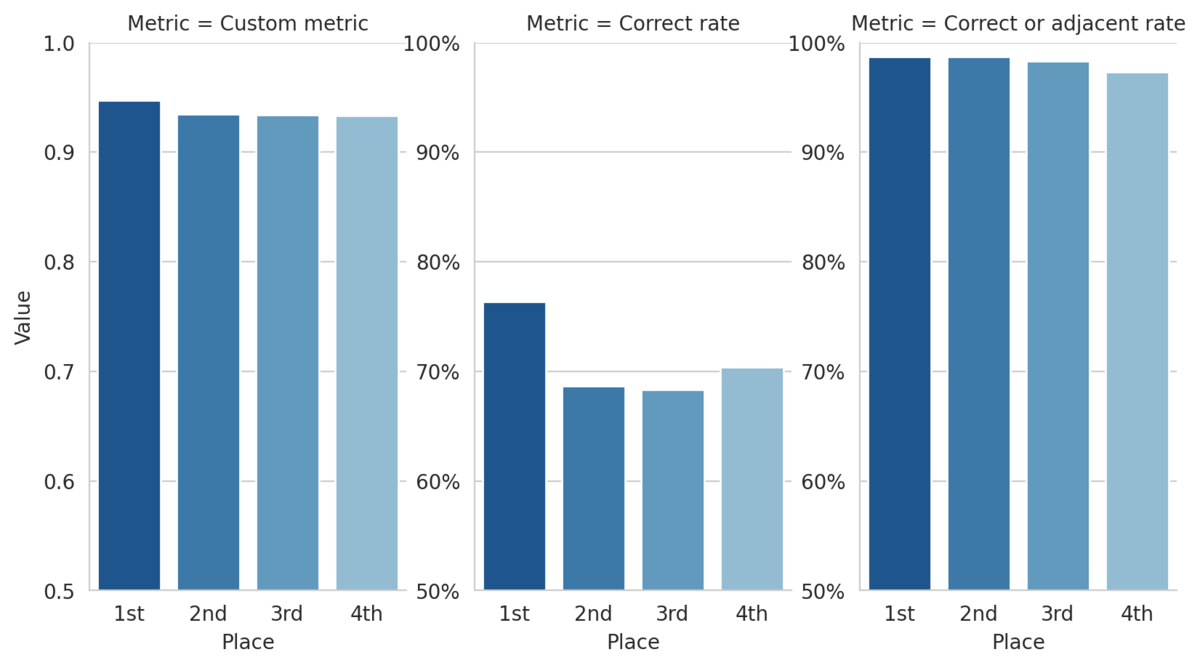
This custom metric can also help us define higher risk "non-adjacent" mistakes as those misclassifications that are more than one class away from the true class. By this definition, the top 3 submissions make non-adjacent mistakes on less than 2% of the 1,500+ slide test set! The figure below shows how the top four models performed on a few metrics.
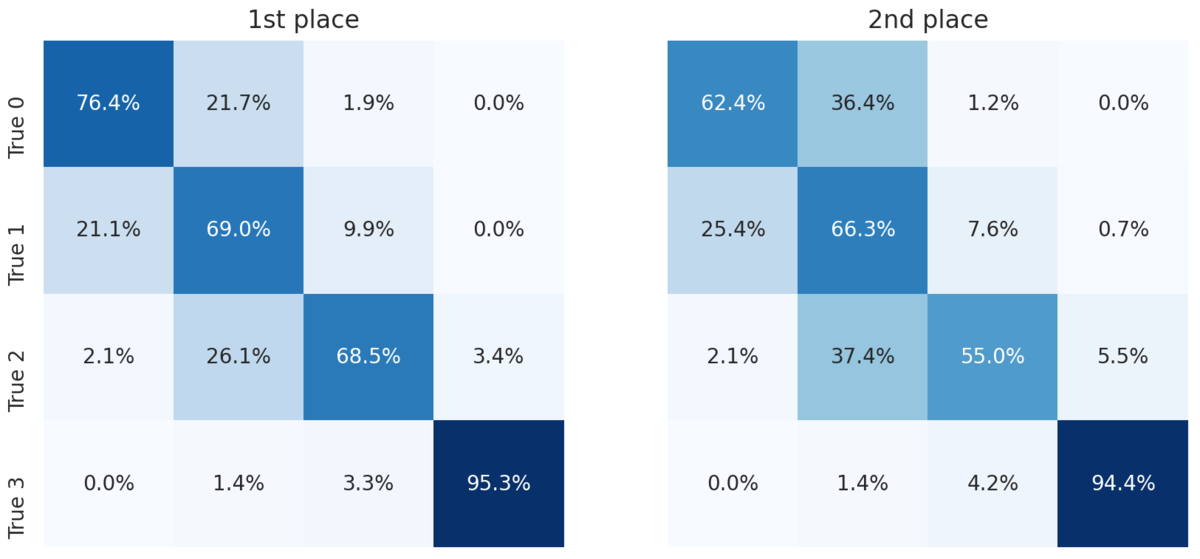
For a more granular look at the performance of the top two models, we can look at the confusion matrices. Each cell shows the percent of slides with the true label for that row that were predicted to have the label for that column.
All the prize-winning solutions from this competition are linked below and made available for anyone to use and learn from. ** Meet the winners and learn how they built their models! **
Meet the winners
Brice Tayart, Capucine Bertrand, Solène Chan Lang, Saïma Ben Hadj, and Tina Rey
Note: Cash prizes were awarded to the teams that shared their solutions under an open source license, but willingness to share solutions did not impact leaderboard positions. This team achieved the highest score and declined the prize.
Place: 1st
Hometown: Paris, France
Team: Tribvn-Healthcare
Username: brice_tayart
Background:
Brice Tayart: I recently completed a Masters degree in AI and work as data scientist at Tribvn Healthcare, a company specialized in histopathological image analysis. I have an interest in both Computer Vision and the health domain, so I’m happy with that!
Prior to that, I worked for 13 years in the geophysical industry, alternatively attending field operations abroad and developing advanced noise filtering algorithms for seismic records, in Matlab and C. The combination sometime gives surprising results, e.g. write a distributed inversion code, then deploy it on a cluster set-up in a backyard shack in Moroccan countryside.
Even though they did not register an account on Driven Data, other members of Tribvn Healthcare IA team assisted in the project, tested some options and contributed though their experience and advice. The team consists in Capucine Bertrand, Saïma Ben Hadj, Solène Chan Lang and especially Tina Rey who trained some of the models which made into the final ensemble. We also had some discussions with pathologists and medical image analysis specialists.
What motivated you to compete in this challenge?
I competed on behalf of Tribvn Healthcare. Personally, I was very interesting in this challenge, as it was a great opportunity to demonstrate skills, gather experience on an exciting dataset and hopefully benefit to patients some day in the future.
Summary of approach:
The inference process is packed into a parallelized pipeline, so that costly operations that can be deferred to the CPU run in the background while the GPU is busy with the segmentation―e.g. tissue detection or reading and decoding the tiff files.
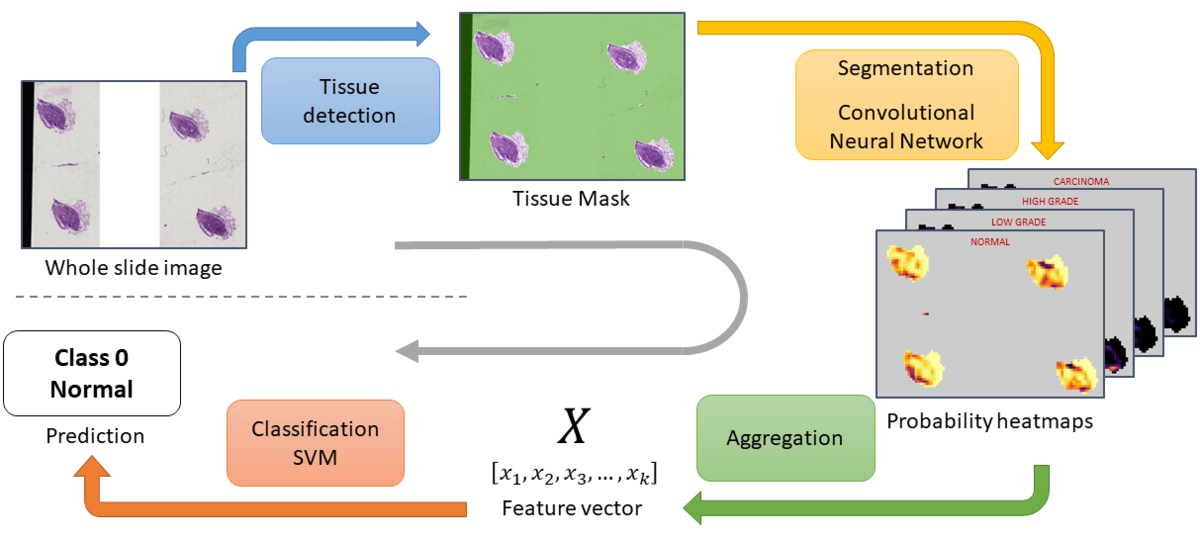
Inference pipeline
- Tissue detection: With a combination of filters that detect the white background, blurry areas, or some obvious artefacts like black stripes, a mask of the tissue areas is computed. On some slides, these regions of interest (ROI) represents only a very small part of the image.
- Building a dataset and training a DenseNet: The goal is to teach a CNN to classify patches extracted from the whole slide image.
- Segmentation and aggregation: The model of step 2 is applied on a sliding window over the ROIs, which gives a segmentation of the tissue. These segmentation maps however contain from less than 10 to several thousand valid data points and are not readily usable. For each class, we look at the distribution of probabilities and a small, fixed number of statistics is computed. All the statistics are concatenated into a feature vector that describes the whole slide image.
- Label prediction: A linear SVM is trained with a K-fold on the validation slides―since the feature vectors on the training set may not be representative of general data due to segmentation model overfitting. The SVM is used to predict the label of the slides as a probability distribution over the 4 classes. Given this distribution and the reward matrix, the average reward expected upon predicting each of the 4 labels is computed. The prediction that gives the highest expected score is picked.
Raphael Kiminya

Place: 2nd
Prize: €12,000
Hometown: Meru, Kenya
Username: karelds
Background:
I’m a Business Intelligence/ Data Warehouse developer.
What motivated you to compete in this challenge?
I enjoy working on data science contests, especially where there is a visible positive social impact.
Summary of approach:
I applied a Multiple Instance Learning approach, where each slide was subdivided into smaller parts that were individually processed. I used this method to extract useful tissue parts (tiles) from the whole slide images. Using page 5 to mask the informative tissue pixels, I generated six datasets with different tile sizes from the 2nd, 3rd and 4th pages of the pyramidal TIF files. This was both to increase the dataset and improve generalization by training a different model for each dataset. Tiles were ranked by their usefulness in classifying the slide, based on the scoring formula discussed in the above article.
During training, the best N tiles for each slide were selected and passed through a Convolutional Neural Network to extract feature vectors. The output features were then aggregated for each slide and pooling and classification was done on the slide level.
Some slides had hundreds of tiles with potentially useful tissue, but I could only fit so many tiles in memory with a reasonably batch size. To allow the model to see as much useful data as possible, I randomly sampled the N tiles from the top N_MAX tiles each epoch (see config.csv file). This also doubled as regularization, further enhancing the model’s generalization.
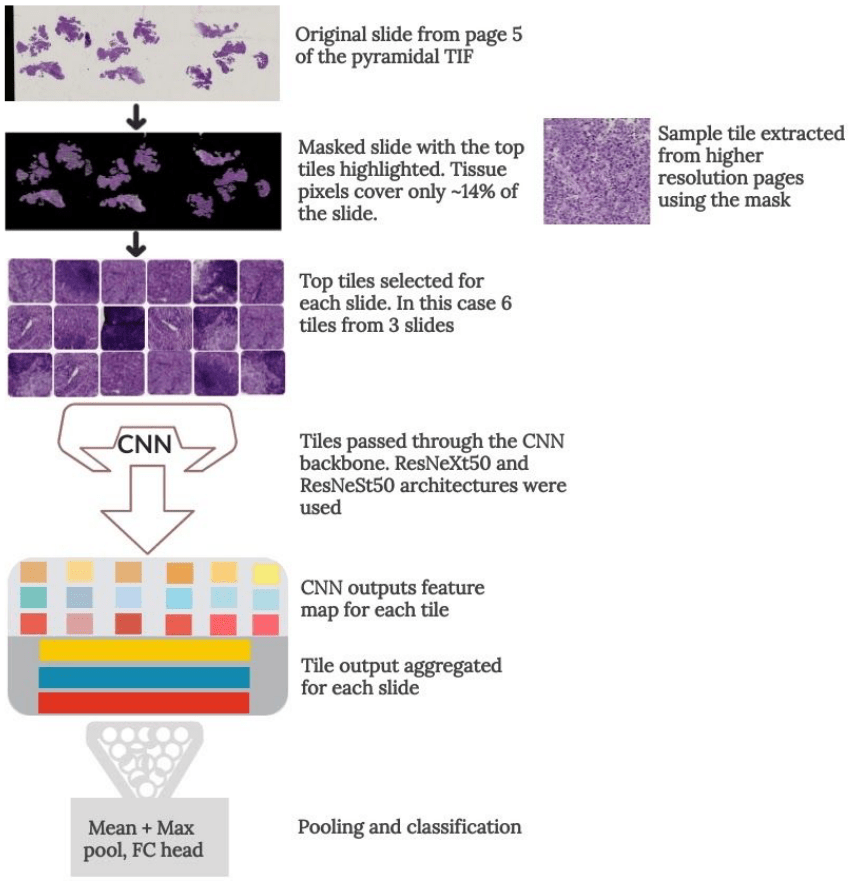
Tile extraction to slide classification
Check out karelds's full write-up and solution in the competition repo.
Kirill Brodt
Place: 3
Prize: €8,000
Hometown: Almaty, Kazakhstan
Username: kbrodt
Background:
Currently, I'm doing research at the University of Montréal in Computer Graphics, using Machine Learning for problem-solving: Learning-based Posing of 3D Characters via Bitmap Sketches. I got my Master's in Mathematics at Novosibirsk State University, Russia. Lately, I fell in love with machine learning, so I was enrolled in the Yandex School of Data Analysis and Computer Science Center. This led me to develop and teach the first open Deep Learning course in Russian. Machine Learning is my passion and I often take part in competitions.
What motivated you to compete in this challenge?
I become addicted to machine learning contests. The interesting part of this challenge are extremely high resolution images and ordinal labels. I also hope it advances medical research.
Summary of approach:
The main challenge here is to work with extremely high-resolution images (e.g. 150,000 x 85,000 pixels). One can reduce the resolution by downsampling them to reasonable sizes, such that a deep neural network (DNN) could work with them but it hurts the performance. On the one hand, we need quite large images with sufficient information. On the other hand, we should be able to pass them into DNN as an input.
One can notice that most of the image has a monotone background (usually white). The simple method to reduce the size is to select the tiles/crops based on the number of tissue pixels. First, divide the image into N x N grid. Calculate the sum or mean of pixels' intensity and then stack top K tiles/crops into one image.
Check out kbrodt's full write-up and solution in the competition repo.
Ming Feng, Kele Xu, Tingzhen Li

|
|
|
Place: 4th
Prize: €5,000
Hometowns: Shandong, Changsha and Jiangxi, China
Team: LifeIs2Short
Usernames: AndrewTal, debut_kele, and amelie
Background:
Ming Feng received his bachelor degree from Ningxia University, Ningxia, China, in July 2018. Currently he is a Ph.D. student at Tongji University, Shanghai, China. His current research interests include medical image processing and weakly supervised learning.
Kele Xu received his Ph.D. degree from Université Pierre et Marie CURIE, Paris, France, in December 2016. Currently he is an assistant professor at National University of Defense Technology, Changsha, China. His current research interests include applied machine learning, silent speech interface (SSI) and multi-modal machine learning. He is also interested in the applications of machine learning for audio signal processing, time series analysis and medical image processing.
Li Tingzhen received her bachelor degree from Xiamen University, Xiamen, China, in July 2019. Currently, she is a graduate student at Tongji University, Shanghai, China. Her current research interests include handwriting recognition and medical image classification.
What motivated you to compete in this challenge?
The TissueNet competition provides very precious data. I want to explore the boundaries of my algorithm and compare the results with other top players.
Summary of approach:
First, we trained a patch-level deep learning classification model to generate probsmap from whole slide images. Second, we extract feature from probsmap. Last, we feed the feature to a mechine learning model to make wsi-level decisions. All our method based on above pipeline. The above pipline can achieve good results. Then we paid more attention to data understanding. It turns out that the understanding of the data is very important.
Check out the team's full write-up and solution in the competition repo.
Thanks to all the participants and to our winners! Special thanks to French Society of Pathology and the Health Data Hub for enabling this fascinating challenge and for providing the data to make it possible!