by
Katie Wetstone
The Challenge
There are tens of thousands of lakes that matter for recreation and drinking water. Cyanobacterial blooms pose real risks in many of them, and we really don't know when or where they show up, except in the largest lakes. Satellites can help, but the high resolution satellites were not designed for this purpose, and simple methods to find these blooms will often mark features that aren't blooms. We need creative solutions that combine methods with satellite and other data to make these satellites help us.
Dr. Rick Stumpf, Oceanographer, NOAA, National Centers for Coastal Ocean Science
Motivation
Inland water bodies provide a variety of critical services for both human and aquatic life, including drinking water, recreational and economic opportunities, and marine habitats. A significant challenge water quality managers face is the formation of harmful algal blooms (HABs). One of the major types of HABs is cyanobacteria. HABs produce toxins that are poisonous to humans and their pets, and threaten marine ecosystems by blocking sunlight and oxygen.

Image source: NASA Landsat Image Gallery
While there are established methods for using satellite imagery to detect cyanobacteria in larger water bodies like oceans, detection in small inland lakes and reservoirs remains a challenge. Manual water sampling is accurate, but too time intensive and difficult to perform continuously.
The goal in the Tick Tick Bloom: Harmful Algal Bloom Detection Challenge was to detect and classify the severity of cyanobacteria blooms in small, inland water bodies using publicly available satellite, climate, and elevation data. The resulting algorithms will help water quality managers better allocate resources for manual sampling, and make more informed decisions around public health warnings for critical resources like drinking water reservoirs.
Results
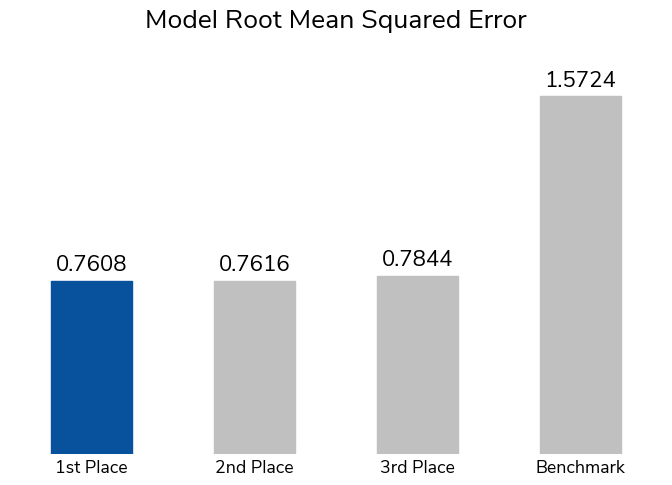
The winning solutions represent the best of over 900 submissions made throughout the competition. The winning submission had an average root mean squared error (RMSE) of 0.76, more than halving the error from the basic benchmark solution. The benchmark fits a LightGBM tree-based model on a few basic statistics of the color values from Landsat and Sentinel-2 satellite imagery.
Participants could use satellite imagery from Landsat or Sentinel-2, climate data from NOAA (including temperate, wind, and precipitation), and elevation data from Copernicus DEM. Ultimately, the desire is to make a cyanobacteria detection model available to water quality managers across the U.S. for everyday use. For a model to work in this context, it can only rely on data sources that are continuously maintained, updated frequently, and cover the majority of the U.S.
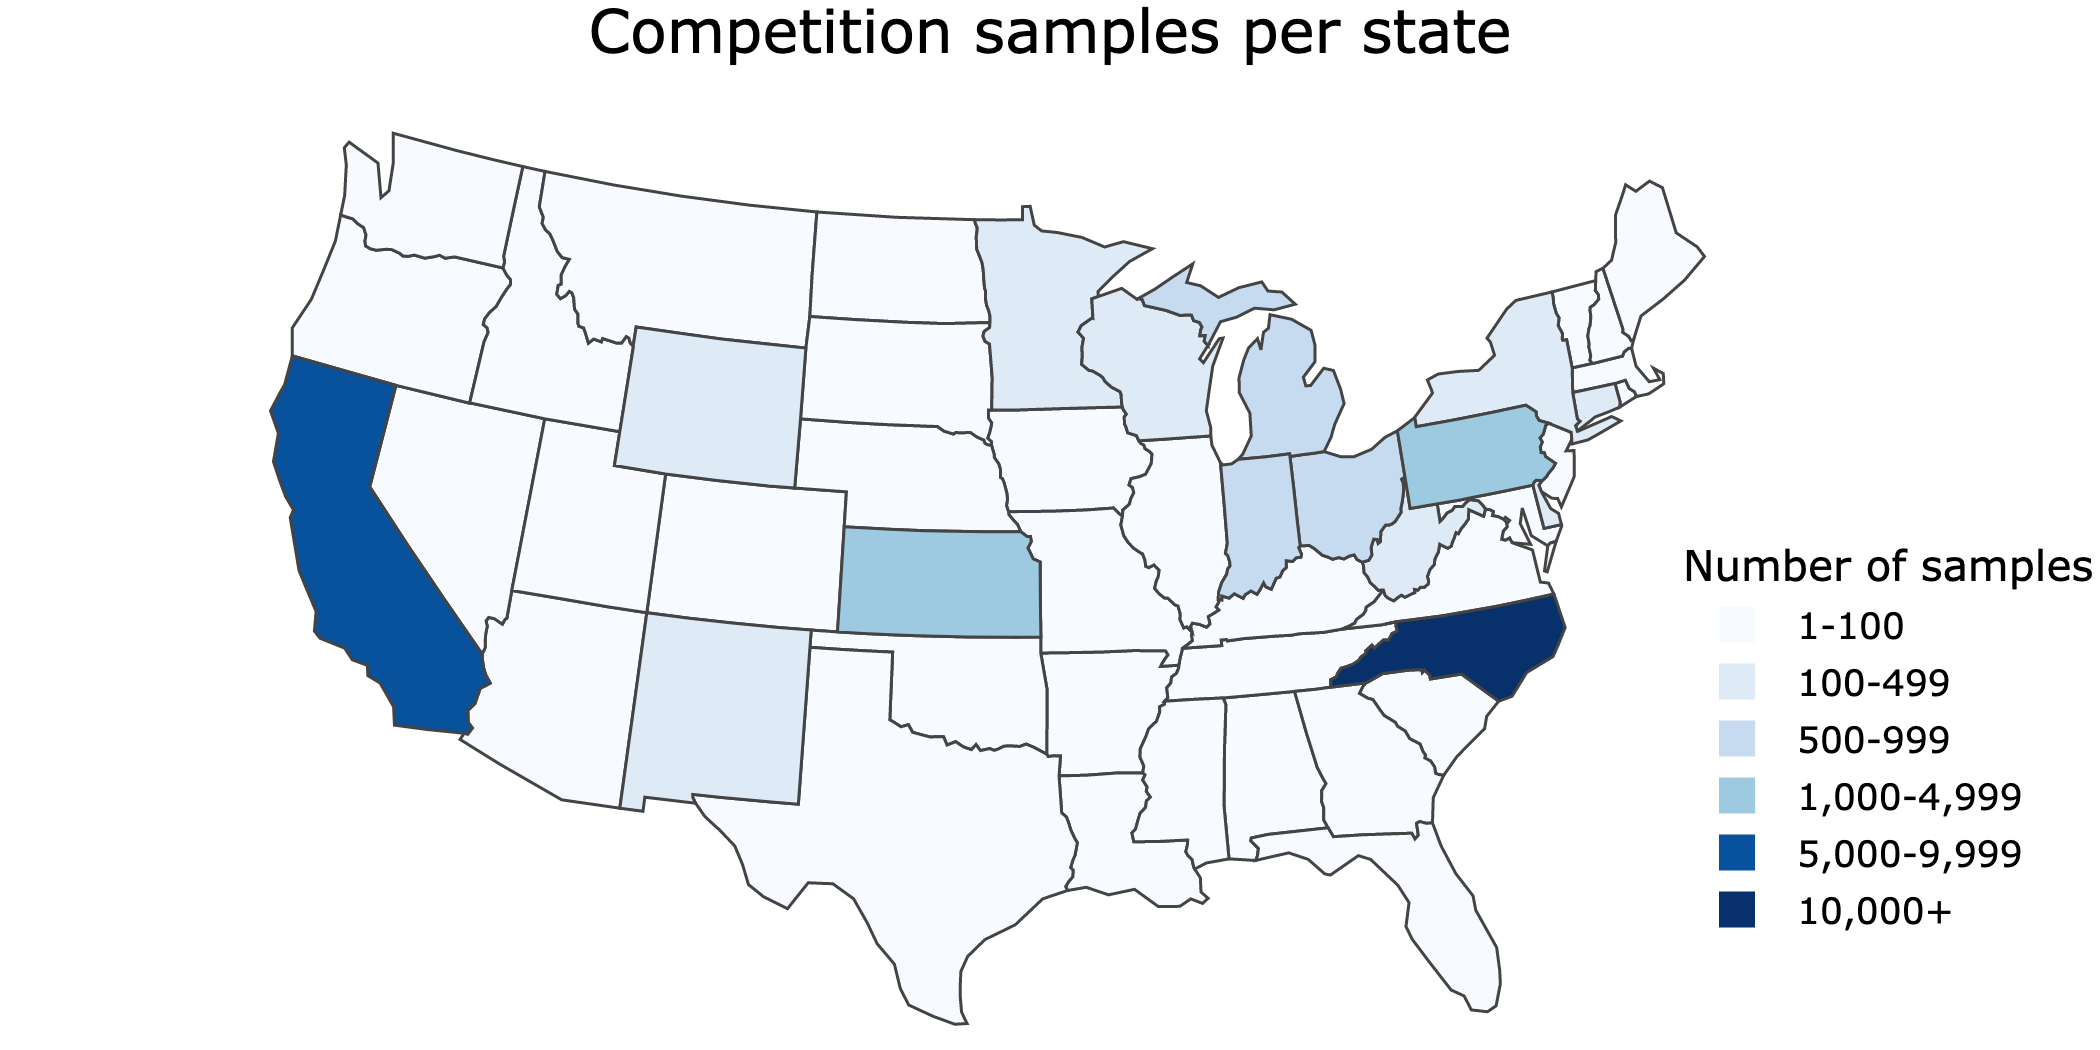
Labels were based on "in situ" samples that were collected manually by many organizations across the U.S. The result was a uniquely large and geographically diverse dataset of cyanobacteria measurements. However, data points were not spread evenly across the country. To make sure models were incentivized to perform well across the U.S., and not just on the most represented areas, RMSE was calculated separately for each region (midwest, northeast, south, and west) and then averaged. The five top-scoring participants were also eligible for a bonus prize for best write-up of methods.
There were a few overarching takeaways from the winning solutions that are likely to advance general research in the field.
Different regions and data providers have distinct patterns of harmful algal bloom occurence. Some winning models benefitted from treating regions differently, even fitting separate models on each region's data. For example, the first place model fit a decision tree using satellite imagery for the midwest and northeast, but did not use satellite imagery for the south and west where they found data quality was lower.
Even when satellite imagery is not high-resolution enough to capture details of a water body, overall statistics of an image's color values are still useful predictive features. The competition data included many small rivers and reservoirs that satellite imagery was not high-resolution enough to capture in detail. This likely prevented convolutional neural networks, which are often used for image features, from performing well. Instead, participants creatively generated overall statistics like the ratio of blue to green or the mean values of each color. Participants also found ways to identify the water body within the image, such as applying K-means segmentation or using the scene classification band in Sentinel-2 imagery. Satellite imagery resolution is a very common barrier in the field of cyanobacteria detection, and the winning methods could help address this obstacle.
Other environmental characteristics matter. The winning participants all supplemented their imagery models with environmental features from other sources. Temperature, humidity, and elevation were the most commonly used, while other potentially relevant characteristics like precipitation and wind did not turn out to provide useful modeling information.
Let's get to know our winners and how they mastered cyanobacteria detection! You can also dive into their open source solutions and model write-ups in the competition winners repo on Github.
Meet the winners
1st Place: Yang Xu
2nd Place: Andrew Wheeler
3rd Place: Raphael Kiminya
Yang Xu

Place: 1st Place & 2nd Place Model Write-up
Prize: $13,000
Hometown: China
Username: sheep
Background
I am a bioinformatic engineer with a master’s degree of Biochemistry. I take part in various data science competitions and have a competition grandmaster tie at Kaggle, as well as some wins at Chinese domestic competitions.
What features did you select for use in your model and why? What preprocessing steps did you take to develop features from raw data?
The entire South region is considered as noisy data since most samples in this region have inaccurate location information. It is important to note that using a powerful model with this low-quality data may result in inaccurate predictions. Although an area-based group k-fold CV may appear to be better for training a tree model in this region, this is due to the unbalanced data label, and using a model trained with unstable data is always risky.
The West region is very hard to predict since most of the samples were collected from small rivers that are less than 10m wide, making data collection extremely difficult. Our Landsat data source has a resolution of 60m, while Sentinel has a resolution of 10m.
As for the rest of the regions, the water regions are relatively larger, and the location information is more accurate. Therefore, I used watercolor features and climate features for these regions to improve prediction accuracy. The watercolor features include mean red, blue, and green values, as well as the 95th percentile values of the water region.
What are some other things you tried that didn’t necessarily make it into the final workflow?
First, I tried using a CNN model with satellite images. Unfortunately, this type of model resulted in very high RMSEs. After some analysis, I suspect that the quality and resolution of the satellite images, as well as the accuracy of the positions, made it very difficult to fit the CNN model well.
Second, I attempted to train a U-Net model to segment the water region of the Landsat image, since many data points were collected before the deployment of the Sentinel satellites. However, the resolution of the Landsat images did not meet the requirements for accurate segmentation.
Andrew Wheeler

Place: 2nd Place
Prize: $9,000
Hometown: Raleigh, NC, USA
Username: apwheele
Background
My name is Andy Wheeler. I have a background in predictive modelling in social science applications (PhD is in criminal justice). Currently I am a data scientist in the healthcare field working on predictive models relating to aspects of insurance claims.
High level summary of your approach
I generated tabular data based on date, location, and elevation of the sample. I additionally used k-means segmentation to try to identify the lake area in the Sentinel imagery, and then extracted out the RGB values for that segmented lake area.
What are some of your most impactful snippets of code?
# I ensemble different boosted models together in the end
# If you pass in multiple models
# this will ensemble them, presumes regressor models
class EnsMod():
    def __init__(self, mods, av_func = 'mean'):
        self.mods = mods #should be dict
        self.av_func = av_func
    def fit(self,X,weight=True,cat=True):
        for key,mod in self.mods.items():
            mod.fit(X,weight=weight,cat=cat)
    def predict(self,X):
        res = []
        for key,mod in self.mods.items():
            res.append(mod.predict(X))
        res_df = pd.concat(res,axis=1)
        if self.av_func == 'mean':
            pred = res_df.mean(axis=1)
        return pred
    def predict_int(self,X):
        pred = self.predict(X)
        pred = pred.clip(1,5).round().astype(int)
        return pred
Raphael Kimina

Place: 3rd Place & 1st Place Model Write-up
Prize: $8,000
Hometown: Meru, Kenya
Username: karelds
Background
I’m a freelance data scientist.
What motivated you to compete in this challenge?
Curiosity. I’m continually amazed by the power of remote sensing in impacting our lives on earth. Having participated in several satellite data competitions, I’ve come to appreciate the immense value that can be derived from this information, and its ability to reveal previously unseen insights about our planet.
High level summary of your approach
My solution uses level 2 data from Landsat 8, 9, and Sentinel 2. For each sample, I extracted observations within a 200m radius of the sample location and up to 15 days prior to the sample collection date. Additionally, I incorporated temperature and humidity HRRR forecasts from the past 24 hours relative to 1200 UTC of the sample collection date.
To tackle the problem, I formulated it as a regression task and employed a gradient boosting algorithm to directly forecast the cyanobacteria severity level. To ensure robustness, I divided the dataset into five stratified folds and trained a separate model for each satellite data and region. The final prediction for the test data is a mean ensemble of predictions from 10 models (2 datasets x 5 folds), rounded to the nearest severity level. In cases where the data was unavailable, I set the severity level to the average of the region’s predictions.
What are some other things you tried that didn’t necessarily make it into the final workflow?
The HRRR forecasts did not perform as well as expected. I tested various variables that could impact cyanobacteria formation and movement, such as temperature, humidity, precipitation, and wind. Of these, only temperature and specific humidity improved the model’s performance on both the local validation and test sets.
Intuitively, elevation should also affect cyanobacteria formation due to its effect on runoff and water stagnation. However modeling with elevation data overfitted the training set and performed poorly on the test set. This suggests a complex relationship between elevation and algae blooms that may be influenced by other factors, such as weather conditions and nutrient levels.
Thanks to all the participants and to our winners! Special thanks to NASA, NOAA, EPA, USGS, DOD's Defense Innovation Unit, Berkeley AI Research, and Microsoft AI for Earth for their collaboration, and to all of the organizations across the country who provided cyanobacteria measurements to make this competition possible.