MagNet: Model the Geomagnetic Field
Absolute directional information provided by the Earth's magnetic field is of primary importance for navigation and the pointing of technical devices such as antennas, satellites and smartphones. We are amazed by the diversity of strategies used by the teams in this challenge to forecast the Dst indices. The results hold immediate promise for the space weather community as we look into integrating the winning solution for our operational needs.
Manoj Nair, Research Scientist, NOAA/CIRES Geomagnetism Group
Motivation
The efficient transfer of energy from solar wind to Earth’s magnetic field can cause massive geomagnetic storms. The resulting disturbances wreak havoc on key infrastructure systems. These include GPS, satellite communication, and electric power transmission. The severity of these geomagnetic storms is measured by the Disturbance Storm-time Index, or Dst. Dst is expressed in nanoteslas (nT) and is calculated based on measurements at four geomagnetic observatories.
As early as 1975, scientists have proposed the use of empirical models to forecast Dst solely from solar wind observations. This type of data is gathered by satellites like NOAA’s Deep Space Climate Observatory (DSCOVR) and NASA's Advanced Composition Explorer (ACE). In the past three decades, empirical, physics-based, and machine learning models have made advances in forecasting Dst from real-time solar wind data. Dst forecasting can help stakeholders like government agencies, satellite operators, and power grid operators analyze the strength and duration of geomagnetic storms and prepare for the worst.

The goal of the competition was to forecast Dst solely from solar-wind observations at the Lagrangian (L1) position using satellite data from NOAA’s Deep Space Climate Observatory (DSCOVR) and NASA's Advanced Composition Explorer (ACE).
While the ML models generally perform better, there is still room for improvement. Predicting extreme geomagnetic events remains especially hard, and robust solutions are needed that can work with raw, real-time data streams under realistic conditions like sensor malfunctions and noise.
The goal of the MagNet: Model the Geomagnetic Field challenge was to develop models for forecasting Dst that 1) push the boundary of predictive performance, 2) under operationally viable constraints, and 3) using specified real-time solar-wind data feeds. This is a hard problem where the best approaches are not evident at the outset. Competitors were tasked with improving forecasts both for the current Dst value (t0) and Dst one hour in the future (t1). For more on the data check out the competition's Problem Description.
Results
Over the course of the competition, DrivenData saw over 600 participants and an impressive 1,200 submissions. The number of submissions is especially notable given the technical constraints of the code execution environment and the limit of 3 submissions per week.
Among the winners, we saw a variety of creative solutions. Competitors used a combination of Long Short-term Memory (LSTM), Gated Recurrent Units (GRU), Convolution Neural Networks (CNN), and Light Gradient-boosted Models (LGBM) to secure the top leaderboard positions. In addition to using different models, competitors experimented with various time windows and imputation methods to deal with sensor malfunctions and missing data.
Prior to the competition, the NCEI (National Centers for Environmental Information) had developed an experimental model for forecasting Dst. However, because the model only predicted t0, a new benchmark was developed for the competition based on some of the specs used in the latest NCEI model. You can check out the blog post walking through how we trained an LSTM for that benchmark here.
The top four prize-winners were able to achieve 11.1 - 11.5 nT RMSE on the private test set, beating the benchmark of 15.2 nT. Interestingly, an ensemble of the top four models does best of all with an RMSE of 10.6 nT, achieving a 30% reduction from the benchmark!
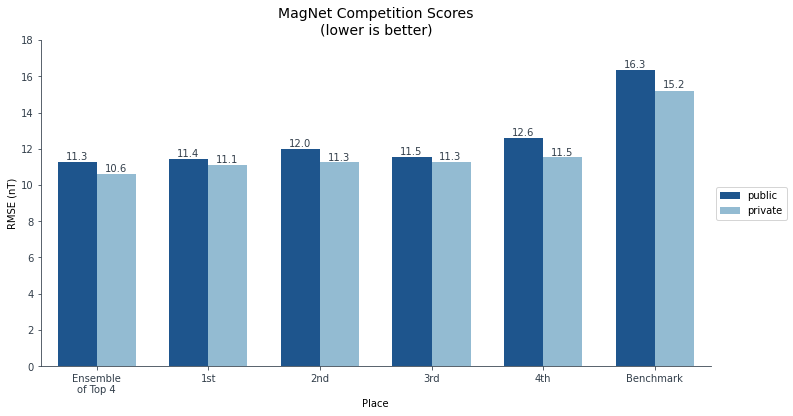
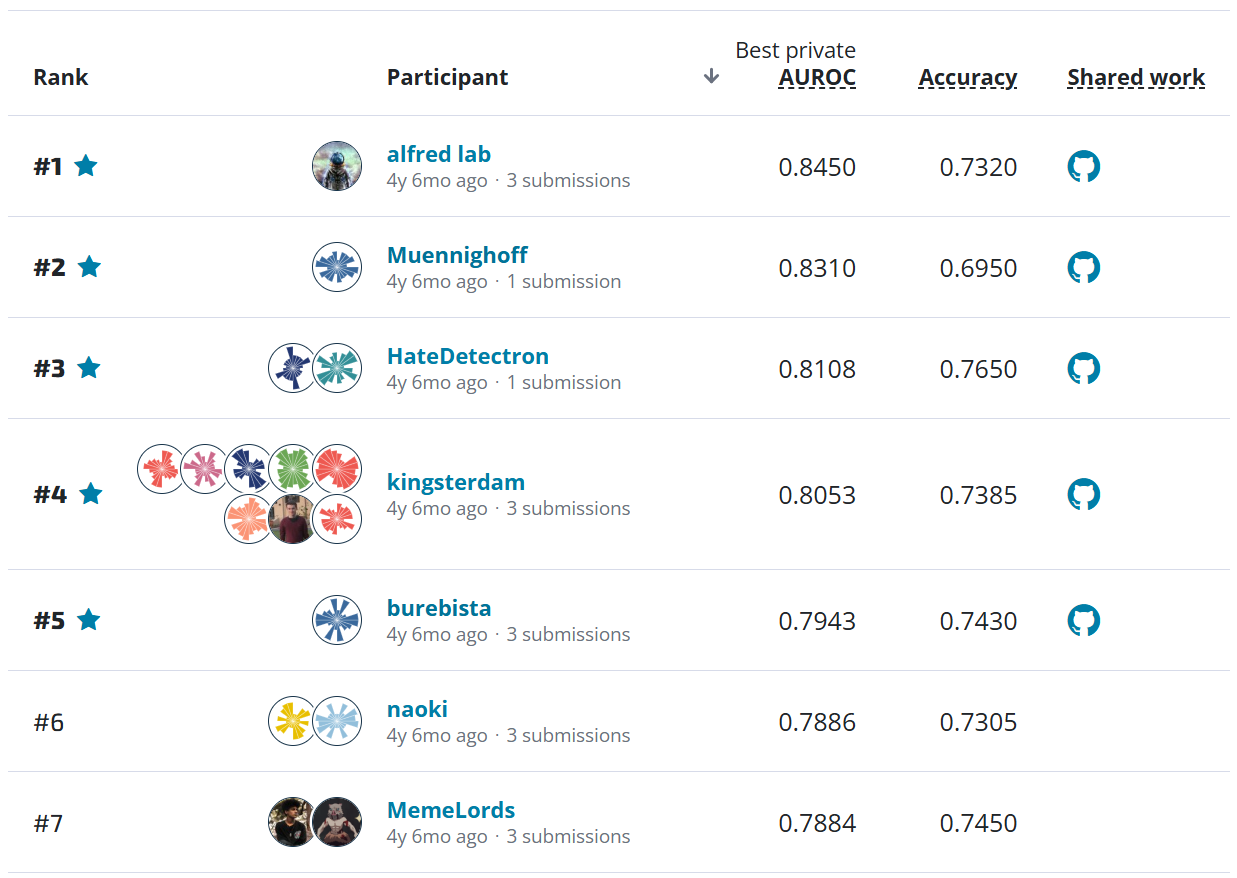
The overall results on the public and private leaderboards. Competitors were ranked using root mean squared error (RMSE) in nanotesla (nT).
In this competition, NOAA was especially interested in predicting extreme geomagnetic events, defined as periods where Dst is less than or equal to -80 nT. The lowest Dst value in the test dataset was -422 nT.
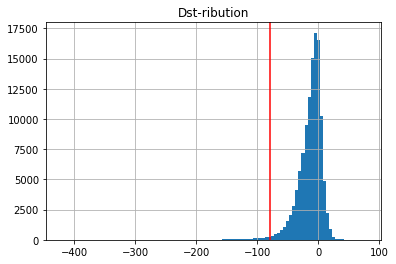
This distribution of Dst values in the dataset. Periods where the Dst is at or below -80 nT (the red line) are considered extreme.
During these extreme periods, solutions achieved between 38-50 nT RMSE, a significant improvement on the benchmark of 76 nT RMSE.
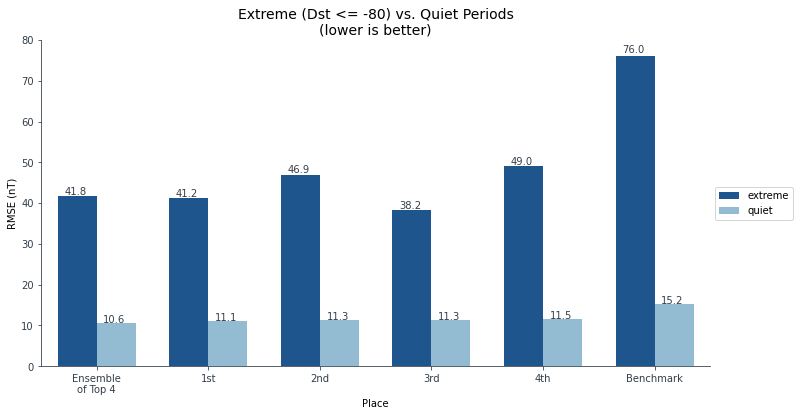
Comparison of Performance in Extreme (Dst <= -80 nT) vs. Quiet Periods
NOAA was also able to verify the winning models by performing inference on an unseen dataset, collected between Nov 1, 2020 through March 4, 2021. This was a fantastic opportunity to see how winning solutions perform on completely new data. During this relatively quiet period, NOAA compared the top four models against its latest, experimental NCEI (National Centers for Environmental Information) Dst forecasting model, and they found that winners were able to push the state-of-the-art on this new unseen data! First place achieved 5.9 nT RMSE to the NCEI model's 6.5 nT, and the ensemble of the top four again performed the best with 5.6 nT RMSE.
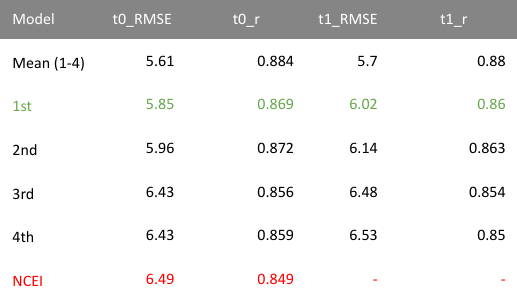
Model verification used coefficients provided by solvers. RMSE reflects root mean squared error in nanotesla, nT (lower is better), r reflects the Pearson correlation coefficient (higher is better).
All the prize-winning solutions from this competition, including detailed reports, have been made available on Github for anyone to use and learn from. Meet the winners and learn how they built their leaderboard-topping Dst forecasting models!
Meet the winners
Ammar Ali

Place: 1st Place Prediction
Prize: $15,000
Hometown: Jableh, Syria
Username: Ammarali32
Background:
I am Ammar Ali, a second year master student at ITMO University, Russia. I am studying programming and computer technologies. My precise specialty is Business Information systems. In addition, I am a computer vision engineer working at ITMO University on three different projects:
- Drive Safely: a project to monitor the driver behavior in car cabins including behavior detection and head pose estimation.
- A recommendation system for enhancing the meditation process
- A project to extract information from 2D Solidworks drawings to automate 2D to 3D conversion in the future.
What motivated you to compete in this challenge?
I started working with competitions on Kaggle 3 months ago and I liked it. When I found this competition on DrivenData, I was also interested so I decided to participate. Time series is somehow a new field for me; I really wanted to learn, and I did. I learned a lot from this competition. Thanks to DrivenData for this amazing competition. Hope to see more soon.
Summary of approach:
At first, I started reading the baseline solution and how to submit a solution to completely understand the problem and what I am dealing with. After that, I started the enhancement of the baseline solution according to the recommendations given in the baseline and my expertise. The major changes I have made are:
- Change the imputation of the missing values to the most frequent strategy.
- Change the testing and validation Data from the tail of the data to the head (because it will not be time connected in this case and it will give more realistic loss values)
- Use all features except satellite position data, and leave the decision of what features to use and what to ignore to the Neural Network.
- Use a dummy model to manipulate the starting point (initialized weights) of my model.
- Build a new model architecture according to my expertise and experiments. The proposed model structure consists of a Bidirectional LSTM connected to a Bidirectional GRU. BI-LSTM-GRU is a well known combination for time-series and text recognition problems. The LSTM layers are followed by 3 dense layers connected to the GRU through a flattened layer. I aggregated the features in one hour increments.
Check out Ammar Ali's full write-up and solution in the competition repo.
Belinda Trotta

Place: 2nd Place
Prize: $8,000
Hometown: Melbourne, Australia
Username: belinda_trotta
Background:
I’m a senior software engineer at the Bureau of Meteorology in Australia, working on a system for post-processing weather forecasts. In my spare time I’m a maintainer for the machine learning package LightGBM. I have a PhD in pure mathematics from La Trobe University.
What motivated you to compete in this challenge?
I’ve been competing in machine learning competitions for a few years, to sharpen my skills and for fun. My favorites are the science-themed competitions like this one. I like learning a little about a new subject area, and I hope that I can contribute in a small way to scientific progress.
Summary of approach:
I trained a separate ensemble of 5 models for time t and t + 1, so there are 10 models in total. The model is a convolutional neural network with rectified linear activations. The model consists of a set of layers which apply convolutions to detect patterns at progressively longer time spans. Thus the earlier layers recognize lower-level features on short time-spans, and these are aggregated into higher-level patterns spanning longer time ranges in the later layers.
I used only the solar wind and sunspots data; I found that the satellite data didn’t help my model. Missing data is filled by linear interpolation, then normalized by subtracting the median and dividing by the interquartile range. I used this approach rather than the more usual mean and standard deviation because some of the variables have asymmetric distributions with long tails. Finally, I aggregated the training data in 10-minute increments, taking the mean and standard deviation of each feature in the increment.
Check out Belina Trotta's full write-up and solution in the competition repo.
Yanick Medina and Hamlet Medina

|

|
Place: 3rd Place
Prize: $5,000
Hometowns: Punto Fijo, Venezuela
Team: LosExtraterrestres
Usernames: camaron_ai, NataliaLaDelMar
Background:
Yanick Medina (@camaron_ai): My name is Yanick Medina. I’m twenty one years old and from Venezuela. I am currently pursuing my undergraduate degree in Electronic Engineering. I achieved the third place in the rodeo II sprint #1 competition and ended up in the first 7% of the M5 forecasting competition. I am passionate about programming and always willing to learn more about ways to solve real-world problems using efficient algorithms and data science.
Hamlet Medina (@NataliaLaDelMar): I am Hamlet and work as a Chief Data scientist at Criteo in Paris. I hold two master’s degrees on Mathematics and Machine learning from Pierre and Marie Curie University, and a PhD in Applied Mathematics from Paris-Sud University in France, where I focused on Statistical Signal Processing and Machine Learning. Before my graduate studies, I worked in Control Systems for Petróleos de Venezuela.
What motivated you to compete in this challenge?
We decided to participate in this challenge because the idea of building a system that can predict the Disturbance Storm-Time Index in real-time using measurements collected from two satellites is extremely cool. Before starting the challenge, we did not appreciate the huge impact that solar wind has on the Earth's magnetic field. With no previous domain knowledge on the topic, we were excited to use Machine Learning to see what we could do. We are always looking forward to solving and learning more about real problems with a potential social impact.
Summary of approach:
Before applying any feature engineering preprocessing, we studied the distribution of the temperature, speed and smoothed sunspot number time series. We noticed some degree of skewness on them. In order to reduce it, we applied Box-Cox transformations. We then computed a series of rolling statistical measures over windows of different lengths. This includes the mean and standard deviation over the last 1, 5, 10 and 48 hours. For each time series, we computed several different features that are detailed in our report. Finally, we were left with a total of 186 features that we later reduce.
Our final solution is an ensemble of 3 models: 1 Gradient Boosting Machine (using the LGBM implementation) and 2 Feed-Forward Neural Nets (NN) with dropout and batch normalization. In the case of the LGBM we train 2 models, one for each horizon (t and t + 1 hour). For the feed-forward NNs, we train only one model.
Check out Team LosExtraterrestres' full write-up and solution in the competition repo.
Kareem Eissa and Karim Amer

|
|
Place: 4th Place
Prize: $2,000
Hometowns: Cairo, Egypt
Team: k_squared
Background:
Kareem Eissa: I am a Senior Research Engineer at Visual and AI Solutions (a Nile University spinoff) with experience in the fields of Natural Language Processing, Computer Vision, and Deep Learning. I have a master’s degree in Informatics from Nile University (Egypt) during which I did a research internship at Siemens Healthineers in Princeton, USA. Over the course of my research, I contributed to three publications in top-tier venues and participated in several data science competitions.
Karim Amer: I am the head of AI/ML at Visual and AI Solutions. I previously worked as a research assistant with the Ubiquitous and Visual Computing Group at Nile University, where I published several papers about satellite image analysis between 2016 and 2018. In 2019, I became a research intern at Siemens Healthineers Technology Center, NJ, USA where I worked on development of cutting edge segmentation models that can be used in multiple clinical applications.
What motivated you to compete in this challenge?
We enjoy participating in data science competitions. The problem of time series forecasting the Disturbance Storm-time Index is intriguing, practical, and challenging.
Summary of approach:
We preprocessed the “solar_wind” data by aggregating hourly features: mean, std, min, max, and median in addition to the first and last-minute features and the difference between them (gradient). We also added the daily ACE satellite positions to our list of features. We utilize the latest 96 hours (4 days) in our model to predict the following 2 hours.
Our model is a 4-block deep convolutional neural network. Each block has two consecutive convolution layers residually connected. The output of the convolutions is passed through Leaky ReLU non-linear activation function then max pooling to reduce the sequence length by a factor of 2. Finally, a fully-connected layer projects the convolutional features to 2 outputs.
We utilize a custom loss function:
Loss = log((y - p)^2)^p + |y - p|
where the logarithm is raised to a power p. This allows us to control over and under shooting of our loss function. We built an ensemble of models using different power parameters p and different seeds and averaged their predictions.
Check out Team k_squared's full write-up and solution in the competition repo.
Thanks to all the participants and to our winners! Special thanks to NOAA for enabling this important and interesting challenge, and for providing the data to make it possible!