
Data and statistics were on public display this year. Even our parents were citing the latest numbers from FiveThirtyEight in the weeks leading up to the election. To many people, their most visible and salient encounter with predictive modeling — which many of us know to be an incredibly powerful way to tackle tough problems — is the national election that just took place. Which is why it's especially unfortunate that election modeling is such a problematic domain for data science.
The real issue is not that almost every model got the recent U.S. election (and Brexit, for that matter) so wrong. That's the symptom. The problem is that, in terms of confidence in results, this was never as reliable an approach as it was presented to be. As proponents and practitioners of data science, we need to recognize the damage that can come when other people place their trust in models that end up letting them down. We need to be responsible for separating well-founded applications of data science with more questionable ones, or we risk eroding the public's trust in our discipline.
When looking at public-facing election predictions as an example, there are three basic issues that together make it a particularly fraught application for predictive modeling.
Unreliable inputs
The issue: Polling inputs have increasingly become marked by systematic biases that are difficult to quantify.
The central predictive factors in most election prediction models was polling data (although some models, including 538, incorporated "fundamentals" as well). Over the past few election cycles, getting reliable data from polls has become increasingly problematic and expensive. There's a great episode of Linear Digressions that gives an overview of some of the key issues. One of the biggest is declining response rates, particularly as fewer people answer their phones: the phone call response rate (people who pick up their phone and then give you an answer to a question) has gone from 72% of people called in 1980, to 61% in 2000, to just 6% in 2012, and now 1% in 2016.
Of course, we know the people who do respond are not a representative sample of the population. As Pew Research pointed out, less educated and non-white Americans tend to be underrepresented in polling responses. These biases matter to the election. By itself, some inherent bias wouldn't necessarily make it impossible to adjust for underrepresented groups to infer the behavior of the broader population. But when response rates are so low, it becomes extremely difficult to capture enough representation from all the groups you care about and to account for the systematic bias that comes into play. Particularly when response patterns make such drastic shifts from election to election and with limited opportunities (elections) to test how those changes affect outcomes, trying to account for these biases becomes increasingly ungrounded and speculative.
While traditional telephone polling is becoming less reliable, we are holding out hope that methods for conducting online polls become more effective. For now, the degraded quality of polling data presents a serious challenge, but may actually be surmountable if not for the next issue.
Very limited "ground truth"
The issue: Election outcomes happen rarely, and shifting demographic trends and party allegiances mean even limited outcomes are less reliable for the world we're trying to predict.
Predictive modeling relies on making inferences about the future from patterns in the past. Training a model involves learning those patterns based on many linked examples of past inputs and the resulting output that we care about. For example, we might use a huge number of labeled pictures of cats and dogs to draw inferences about what characteristics make an image likely to be a cat or a dog. This in turn allows us to generalize to new data and predict the right label for an image we haven't seen before. Data quantity is important because it gives us more confidence that we've seen a representative set of possible cases to infer from.
In the case of national presidential elections, we only get to see how people actually vote every four years. Other elections may be helpful, but there is good reason to believe that primaries or midterm elections would not be representative of behavior for general presidential elections. With modern polling data, you have a handful of outputs to use at best. And given marked differences in the appeal of candidates to voter demographics in this election compared with past ones, the applicability of even those few historical cases becomes more tenuous.
The truth is, we have even less data than simply "years the nation has been around divided by four" because the older these elections are the more worthless they are for modeling purposes today. While pictures of cats and dogs from 100 years ago would probably still be fine for training a cat/dog classifier in 2016, it's fair to say that the United States was a very different place just a few elections ago.
You might point out that we have more outputs than just the Federal executive branch for each election, for instance by breaking down results at the state or county level. Local data was definitely incorporated into existing models, and provided a few more data points to work with. However, as we saw again in this election (but already knew in principle), the results of each state or county are far from independent of one another. Unfortunately, the intense correlation between all levels of voting means that we can't reliably treat each of these results as a separate training case, and so again we're left with a limited scope of training data to work with.
Ultimately, this problem surfaces in two separate ways when building models. The first (and the one that gets most attention) is how to extrapolate from polling results to the responses of the full voting population. Then there's a second gap to infer how polling responses (even if known for every person) translate into actual voting behavior on election day. Unfortunately this link between poll response and vote is likely different in different elections — in this election, for instance, some voters may have felt reluctance to voice support for Donald Trump but ultimately opted for his ticket over other candidates in the voting booth.
That, of course, is speculation. It's one way of many ways that experts have used to explain variation between polls and votes. This gets at a final issue with such limited outputs: even once the results of the election are known, it's difficult to assess fairly how well models performed, which leads to fuzzy accountability and poor basis for learning how to improve.
An argument aired repeatedly in defense of this year's election models is that the issue with the model output is really how probabilities are interpreted. For example a 35% chance of winning still means that the candidate wins more than one out of three runs of the election. The question then is how are we supposed to hold these models accountable? How are we to say that a model was right or wrong, when we only have one (or very few) independent outcomes to go off?
You can defend any model as long as the modeling choices were plausible and the probability of the outcome which actually occurred was above zero. Of course, the natural response would be to look at which probability was highest for the outcome that proved true. But that's not really what probability means here either. If predicting an election is similar in spirit to modeling the bias in a weighted coin and conducting a single toss, then a model for the probability of the coin landing heads or tails isn't really "right" or "wrong" given a single observation of heads or tails provided it did not say the outcome was impossible. You can only really quantify how far off the model's guess about the coin was (and improve its performance) by observing more and more flips and figuring out how likely the observed data is under the model being evaluated.
So the traditional ways we would assess the strength of a model — and the basis for how we would improve it — rely on much more outcome data. Here every model we saw projected a Clinton victory, and also had a valid defense that they weren't wrong when Trump won election night.
Unconvincing usefulness
The issue: The value created from having up-to-the-minute public projections for the outcome of the election is weak at best, especially with such unreliable projections.
This is the largest concern of the bunch. When looking at a possible predictive modeling project, the number one question is always what actions it enables which would warrant the investment of time, talent, and resources. In this case, we spent too much time talking about who was "winning" and too little time talking about the underlying problem.
To start, there are undoubtedly use cases around the election that do warrant more dedicated, timely efforts to predict the outcome. Each campaign needs to know how to focus its energies, which depends on where their candidate stands. They often have access to richer and more reliable voter data than public polls. Financial markets seek to reflect the most current projections for the future, and there are plenty of analysts working on their own models for election outcomes and what they will mean. These are separate questions from whether public-facing forecasts are worthwhile.
For public-facing models, the use case is flimsy. Mona Chalabi, Data Editor for the Guardian, gave a thoughtful interview on Partially Derivative about this very topic that is worth listening to. In general, people want to know what to expect, and how their candidate is doing. Maybe this affects how hard they pay attention, or how much they talk with friends and family, or whether they spend extra time and energy on activities like canvassing, when they could spend that time on other things important to them. I agree these can be benefits, although not strong ones, and in this case the models aren't reliable enough to support them.
People might also use the projections in ways that bear directly on the outcome itself. They may want to know whether they think they can afford to cast a vote for a third party or off-ballot candidate. They may want to know whether they need to go through all the effort to vote at all. Your vote probably shouldn't depend on how others vote anyway (assuming you know which are the plausible contenders), but it's also naive to think that people won't be affected by what they perceive to be the position of the candidates when making these decisions.
We're left with a situation where any decision made by the public based on these models is ill-founded, which makes you question the amount of time and attention that was dedicated to talking about the numbers at every turn. In this way it's more like sports projections—say predicting the margin of victory for the Super Bowl (or World Cup final, if you prefer). You can do as much advanced analysis as you want, but there is a lot about how things will play out that you will not know based on the inputs. You have to see what happens come the day of the event. And in both cases those projections really shouldn't affect the actions you take (to not watch the game, say) unless you are gambling.
Looking ahead
Ultimately, the moral here is that even very intelligent data experts using very advanced methods are at the mercy of a problematic setup to begin with. As DJ Patil (who knows a thing or two about data science at the national level) noted in his own recent interview with Partially Derivative, "Something we have to confront — what does it mean when someone slaps a label on something that says 'Data Science Verified'? As data scientists, all of us need to take a very serious look at that and say does that meet our bar. When they sell something they are representing it on behalf of the community." We need to recognize that what makes good data science is not just the tools and methods you use; it matters what problem you've chosen to apply them to.
With so many people interested in the outcome of the election, we're unlikely to see a diminished interest in tracking who's winning and by how much. This leaves us with a few questions. Can we communicate better when using these models, so that the public has a better understanding of how much to rely on them? Should we be spending as much time and talent on these projections as we are? Could changing how we talk about them leave room for more coverage of a candidate's position on issues and what they mean for people, rather than what the most current numbers say about their position in the race? In general what is the right way to use these models in the context of an election?
As we attempt to learn from the experience of publicly predicting the 2016 election in real time, the data community should confront these questions in addition to speculating about how to tweak our modeling approaches the next time around. After all, figuring out ways to learn from the past and do better going forward — that's what we do.
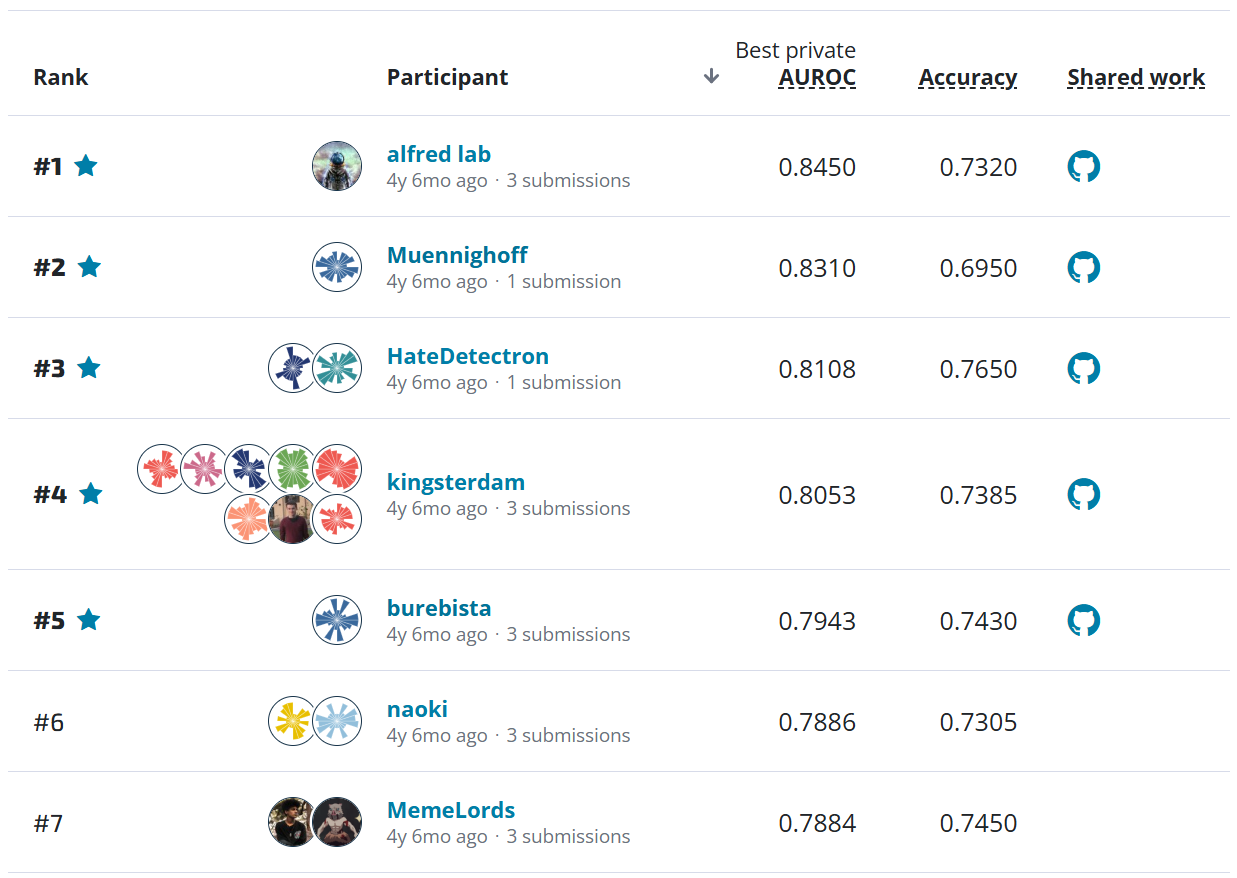
Even we couldn't resist asking our community to think about this modeling question, as a playground for them to practice and test out a range of models against the public data that's out there. You can learn more about the results here.