The Challenge
Multispectral satellite imagery such as that captured by Sentinel-2 can be obscured by clouds, particularly in tropical regions. To obtain adequate analytical results, it is essential to precisely detect clouds in these images and mask them out from any Earth surface analysis, such as land cover classification.
The models developed in this competition enhance our ability to classify cloudy pixels better, resulting in higher quality input data for those analytics. Moreover, these models' open-source nature helps the community further advance the state-of-the-art algorithms for cloud detection.
Hamed Alemohammad, Executive Director & Chief Data Scientist, Radiant Earth Foundation
Motivation
Satellite imagery is critical for a wide variety of applications from disaster management and recovery, to agriculture, to military intelligence. A major obstacle for all of these use cases is the presence of clouds, which cover over 66% of the Earth's surface (Xie et al, 2020). Clouds introduce noise and inaccuracy in image-based models, and usually have to be identified and removed. Improving methods of identifying clouds can unlock the potential of an unlimited range of satellite imagery use cases, enabling faster, more efficient, and more accurate image-based research.
This competition is based on data from the Sentinal-2 mission, which is an effort to monitor land surface conditions and the way that they change. Sentinel-2 imagery has recently been used for critical applications like:
-
Tracking an erupting volcano on the Spanish island of La Palma. Satellite images showed the path of lava flowing across the land and helped evacuate towns in danger
-
Mapping deforestation in the Amazon rainforest and identifying effective interventions
-
Monitoring wildfires in California to identify their sources and track air pollutants

|

|
Results
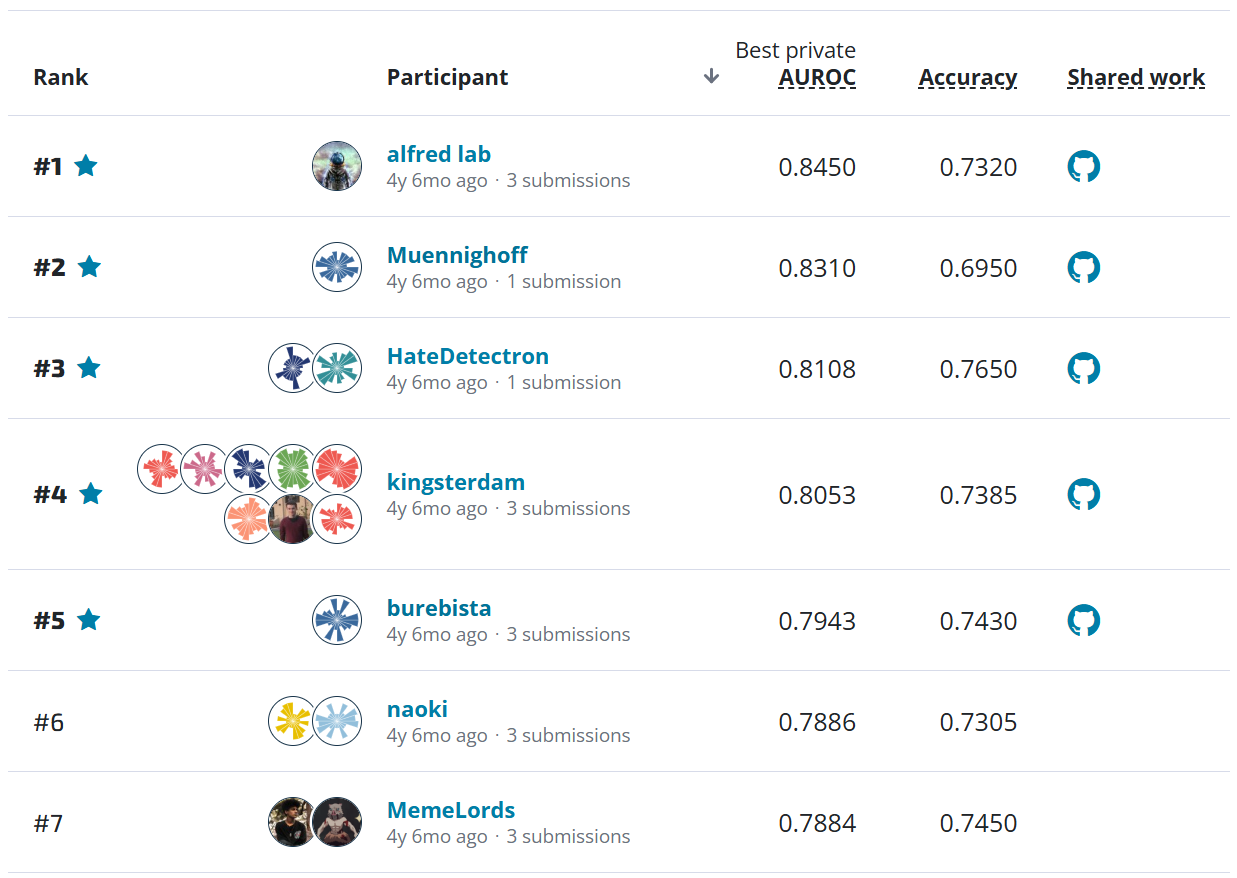
Participants were able to clear the clouds with more than 2,800 submissions over the course of the competition! The top model achieved a Jaccard score of 0.8974, indicating an extremely high similarity between the labels and the predictions. It caught 91% of all cloudy pixels (recall), and 94% of the pixels it labeled as clouds were correct (precision). Many participants scored similarly high, with an impressive 36 users achieving a Jaccard index of at least 0.89!
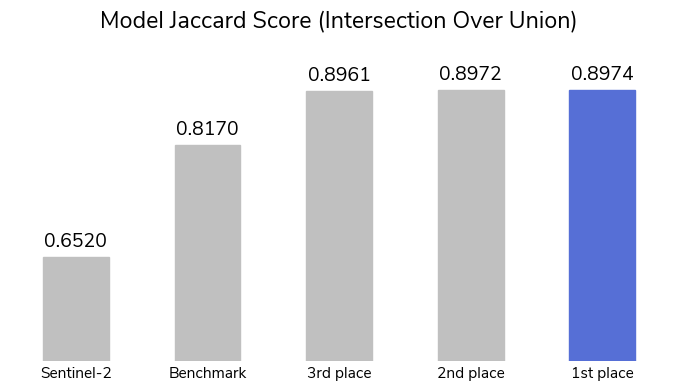
The Sentinel-2 dataset includes a prediction for cloud cover based on a series of threshold filtering steps. Thresholding methods take advantage of the spectral properties of clouds and set cutoff values for various spectral bands. The built-in Sentinel-2 algorithm's Jaccard score was 0.652 (shown above).
To help participants get started, a low-effort benchmark model was provided using PyTorch Lightning to train a standard convolutional neural network (CNN) called U-Net. The benchmark's Jaccard score was 0.817, demonstrating the advantages of even a basic CNN model over simpler strategies like threshold methods.
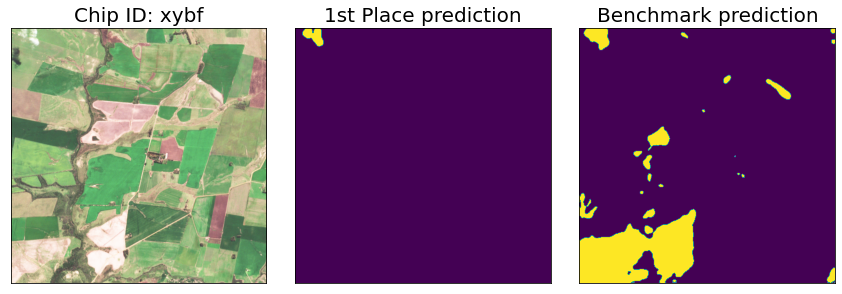
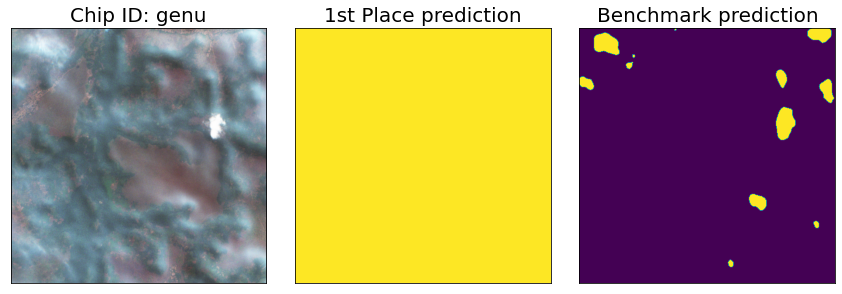
The top models made significant gains, particularly on two key obstacles in the field: distinguishing clouds from other bright objects and detecting thin clouds (Kristollari & Karathanassi, 2020).
The competition saw a wide variety of strategies to tackle this problem. Some of the commonalities across the best models are listed below.
-
All of the winning participants heavily augmentated the training images, which increases the generalizability of a model by adding diversity to the training data. The top models also used test time augmentation (TTA), and generated predictions based on modified versions of the test set.
-
Participants were permitted to use any of the 10 image bands available in the Sentinel-2 dataset, each of which captures a different range of wavelengths. All of the winning participants limited the bands of wavelength to only the four provided with the competition data - first place only used three of the four bands. Limiting the information available can help avoid overfitting a model to the training dataset.
-
The top models were all built using U-Net architecture, a common semantic segmentation approach that combines an encoder network with a decoder network. Combining low-resolution features generated by the encoder with high-resolution features generated by the decoder enables U-Net to capture both larger-picture trends in an image and fine-tuned details.
To learn more about each of the winning approaches, read on! The code for each winning submission is also available in our open-source competition winners repository.
Meet the winners
- 1st Place
- Aditya Sinha
- 2nd Place
- Gui Cheng, Xuechao Zhou, Yang Pan, Yueming Sun, and Zhenfeng Shao
- 3rd Place
- Victor Durnov
Aditya Sinha

Place: 1st Place
Prize: $10,000
Hometown: New Delhi, India
Username: adityakumarsinha
Background
I work as a System Architect and have around decades of experience involving the development of frameworks targeted towards Telecom Data Processing. The last 4-5 years I have been exploring different ML techniques and got interested in Deep Learning in the last 2 years. I enrich my ML knowledge by participating in different competitions on various competition platforms like Kaggle and Driven Data. I have completed a couple of courses on Coursera and taken a PG diploma in data science. I like to design, explore algorithms, and ultimately code them.
What motivated you to compete in this challenge?
For past few months I have been participating in competitions hosted on DrivenData. Most of the competitions are trying to solve certain problems around our environment and nature. So contributing towards this noble cause is one of the motivations. Other motivations are technical in nature like satellite images, noisy labels, raw data set and semantic image segmentation as it is one of my favorite areas in deep learning.
Summary of approach
Training methodology
- I have used GroupKFold to create 5 folds with location as group.
- I have used commonly used augmentations (from Augmentation library) like random crop, ShiftScaleRotate, and GridDistortion.
- Custom augmentation: In low cloud coverage image (coverage < 0.3), clouds are added from other low cloud coverage images. This augmentation is included in the final submission and improved the score.
Inference methodology
- Simple average of predictions from all the models with threshold of 0.5 to convert prediction into binary.
- I have used Horizontal flip and vertical flip augmentation during test time
Choosing model backbones
- The main factor for this decision is the inference time which is 4 hours. Based on these criterion and some experiments I have chosen 3 models: UNET with tf_efficientnet_b1 backbone, UNET with tf_efficientnetv2_b2 backbone, SegformerForSemanticSegmentation-B1 (From HuggingFace)
- I want to use 1 transformer based segmentation model with intuition that with its global attention it will comfortably identify images with no cloud or all cloud. Segformer can adapt to different inference time image size, other transformer based segmentation models like based on Swin transformer can’t adapt to different sizes.
Ultimately, an ensemble including only UNET with tf_efficientnet_b1 backbone and SEGFORMER-B1 performed best on the leaderboard.
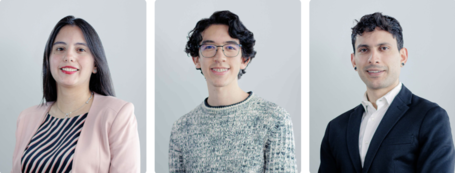
Gui Cheng, Xuechao Zhou, Yang Pan, Yueming Sun, and Zhenfeng Shao
|
|
|
|
|
Left to right: Gui Chen, Yang Pan, Zhenfeng Shao, Yueming Sun, and Xuechao Zhou
Place: 2nd Place
Prize: $6,000
Hometowns: Xinyang City, Henan Province; Luanggang City, Hubei Province; Luoyang City, Henan Province; Luangmei City, Hubei Province; Xinyang City, Henan Province
Usernames: Team IG NB - XCZhou, cloud_killer, Sunyueming, mymoon, windandcloud
Background
We are a team from Wuhan University, China. Our members are Xuechao Zhou, Yang Pan, and Yueming Sun, who are current graduate students in Photogrammetry and Remote Sensing, Gui Cheng, who is a current PhD student in Photogrammetry and Remote Sensing, and Professor Zhenfeng Shao, who is mainly engaged in teaching and research in the direction of smart cities and urban remote sensing.
What motivated you to compete in this challenge?
Our majors are both in remote sensing, and we have recently been conducting research in the direction of cloud detection of remote sensing images. We just saw this challenge and we were both very interested in it, and we thought it was a good opportunity to put our research knowledge into practice.
Summary of approach
As there are many error labels in the original dataset, we first clean the dataset, and according to our research and study on cloud detection, we choose the UNet++ model as our base model to train and predict the original dataset. Then we visualize the labels of the images whose predicted MIoU is lower than 70% and remove the incorrect labels from the manual assisted screening.
After that, the cleaned dataset is randomly divided into training and validation sets, and the operation is repeated to obtain five training and validation sets with different distributions for training, and the best-performing model and its dataset division are selected for integration based on the validation results. Finally, according to our experimental results, Test-Time Augmentation (TTA) is performed on the UNet++ model with efficientnetv2_rw_s as encoder during testing to increase the generalizability of the model.
Victor Durnov
Place: 3rd Place
Prize: $4,000
Hometown: Omsk, Russia
Username: Victor
Background
I'm an independent Software Developer/Data Scientist interested in hard algorithmic challenges and machine learning
What motivated you to compete in this challenge?
I love to solve such challenges, participating on other similar platforms as well. This one gave me the chance to improve my segmentation models.
Summary of approach
The final solution is the ensemble of 8 Unet-like models with different pretrained encoders (resnet34, efficientnetv2_b0, efficientnetv2_s, efficientnet_b0, efficientnet_b3) from TIMM
- 3-bands and 4-bands images with different preprocessing used as input (min-max normalization, thresholds for each band).
- Train/Validation split made by location evenly using number of samples. Refer to
create_folds.pyfor details. - Modified metric used to select best checkpoint: Jaccard index calculated for each location separately and then averaged.
- Training loss:
jaccard + 0.1 * focal - Augmentations used: random flips, rotations, scale, cut-outs, elastic. Horizontal test-time augmentation used on prediction.
What are some other things you tried that didn’t make it into the final workflow?
- Tried to use additional B01, B11 and SCL bands from Planetary Computer, but no improvements on both local CV and Leaderboard.
- Using of larger encoders or additional bands tends to fast overfitting and worse results.
- No data or labels cleaning performed, this worsened results both on CV and leaderboard.
Thanks to all the participants and to our winners! Special thanks to Microsoft AI for Earth and Radiant Earth Foundation for enabling this important and interesting challenge and for providing the data to make it possible!