Pushback to the Future: Predict Pushback Time at US Airports - Benchmark
Coordinating our nation’s airways is the role of the National Airspace System (NAS). The NAS is one of the most complex transportation systems in the world. Operational changes can save or cost airlines, taxpayers, consumers, and the economy at large thousands to millions of dollars on a regular basis. It is critical that decisions to change procedures are done with as much lead time and certainty as possible. One significant source of uncertainty comes right at the beginning of a flight: the pushback time. A more accurate pushback time can lead to better predictability of take off time from the runway.
For this competition, your task is to train a machine learning model to automatically predict pushback time from public air traffic and weather data. In the Open Arena, you will work with 2 years of data to train a model and submit predictions for a validation set. In the Prescreened Arena, you will submit your trained models and inference code to run on a test set of held out data.
In this post, we'll give a quick tour of the features and labels and demonstrate a simple benchmark. That should give you an idea for how to start creating your own solutions and submitting to the Open Arena and Prescreened Arena.
The competition includes data for 10 airports spread throughout the continental US. Here's a map showing their locations.

from datetime import timedelta
from pathlib import Path

import matplotlib.pyplot as plt
import numpy as np
import pandas as pd

airports = [
    "KATL",
    "KCLT",
    "KDEN",
    "KDFW",
    "KJFK",
    "KMEM",
    "KMIA",
    "KORD",
    "KPHX",
    "KSEA",
]
Let's start by looking at a single airport KATL in Atlanta, GA.
airport = "KATL"
Get the data
To run this notebook, you'll first need to download the following files from the Data download page (available after you've joined the competition):
Airport data (
<airport>.tar): A tar archive containing labels and air traffic and weather features for a single airport from 2020 - 2022. Each feature is saved as a bzip2-compressed CSV. There is one file per airport.Submission format (
submission_format.csv): The simplest valid submission to the Open Arena that predicts 0 minutes to pushback for all flights. Use this as an example of a properly formatted submission.
Note that in the Prescreened Arena, you may use the Open Arena's validation set as training data. Those training labels are available as the "Training labels" file via the Prescreened Arena's Data download page.
Once you have downloaded the data files, you can unpack the tar archives. For example, unpack KATL with:
tar -xvf KATL.tar

# or to extract all of them at once
find . -name 'K*.tar' -exec tar xvf {} \;
which should result in the following files:
├── KATL
│   ├── KATL_config.csv.bz2
│   ├── KATL_etd.csv.bz2
│   ├── KATL_first_position.csv.bz2
│   ├── KATL_lamp.csv.bz2
│   ├── KATL_mfs.csv.bz2
│   ├── KATL_runways.csv.bz2
│   ├── KATL_standtimes.csv.bz2
│   └── KATL_tbfm.csv.bz2
└── train_labels_KATL.csv.bz2
Then you can delete the tar file. The rest of this notebook assumes that the data are extracted to a directory named data in the same directory as this notebook.
DATA_DIRECTORY = Path("./data")
We can start by looking at the prediction target: pushback time.
Let's look at the first few labels for KATL:
airport = "KATL"
pushback = pd.read_csv(DATA_DIRECTORY / f"train_labels_{airport}.csv.bz2")
pushback
Check out the Problem Description for an explanation of the labels and features.
The "Fuser ETD minus 15 minutes benchmark"
For this benchmark, we'll use the existing Fuser estimated time of departure (ETD) as the basis for our solution. Fuser is a data processing platform designed by NASA as part of the ATD-2 project that processes the FAA's raw data stream and distributes cleaned, real-time data on the status of individual flights nationwide.
Let's take a look at Fuser ETD data. This table tracks the estimated departure time for flights departing from an airport. It typically contains many estimates for each flight:
gufi: GUFI (Global Unique Flight Identifier)timestamp: The time that the prediction was generatedestimated_runway_departure_time: Estimated time that the flight will depart from the runway
Note that the ETD in this table refers to the time the flight will depart from the runway, whereas the prediction target we're after is when the flight pushes back from the gate. To account for that, we'll subtract 15 minutes from the estimated_runway_departure_time as an estimate of pushback time. This is just a rough estimate; a slightly less simple model could learn the proper adjustment from the data!
etd = pd.read_csv(
    DATA_DIRECTORY / airport / f"{airport}_etd.csv.bz2",
    parse_dates=["departure_runway_estimated_time", "timestamp"],
)
etd
Submission format
The submission format gives us a list of flights and times for which we'll need to make predictions.
submission_format = pd.read_csv(
    DATA_DIRECTORY / "submission_format.csv", parse_dates=["timestamp"]
)
submission_format
We can begin to prototype our solution using a single flight and prediction time. Let's use the 200th row of the submission format.
row = submission_format.iloc[200]
row
This row assumes it is 2021-12-05 21:00:00 and we're looking for a time to pushback prediction for the flight with GUFI AAL1008.ATL.DFW.211204.2135.0163.TFM.
Now let's look at the ETD dataframe for entries for that flight:
etd.loc[etd.gufi == row.gufi]
Notice how the departure time was estimated many times during the lifespan of this flight.
How we handle time is a critical aspect of this competition: we must only use features from 30 hours before the prediction time up until the prediction time itself. The following cell will filter the ETD features to just that time period (as well as just those entries that relate to the flight we are predicting).
now_etd = etd.loc[
    (etd.timestamp > row.timestamp - timedelta(hours=30))
    & (etd.timestamp <= row.timestamp)
    & (etd.gufi == row.gufi)
]
now_etd
It looks like there are two ETD estimates in that time range. We will use the most recent, since we might expect it to be the most accurate.
Finally we subtract 15 minutes since pushback is typically about 15 minutes before the ETD.
flight_pushback = now_etd.iloc[-1].departure_runway_estimated_time - timedelta(minutes=15)
flight_pushback
The submission format expects a prediction of the number of minutes (as an integer) from the current prediction time to the estimated pushback time.
flight_minutes_to_pushback = np.round(
    (flight_pushback - row.timestamp).total_seconds() / 60
).astype(int)
flight_minutes_to_pushback
Simple right? Now we can just repeat this process for each of the rows of the submission format and each airport in our dataset.
But first, we'll want to consider some speed optimizations for solution. Your submission to the Prescreened Arena will need to process 1,800 time points and run in under 10 hours. It would take a very long time to run this ETD lookup for each of the >300k rows for this airport. We can speed things up by taking advantage of parallelization.
Let's get all of the flights for one prediction time. (As you'll see later in this post, that's how the code execution environment processes your submission.) As you can see, we need to make predictions for 79 flights at KATL for this prediction time.
now_submission_format = submission_format.loc[
    (submission_format.timestamp == row.timestamp)
    & (submission_format.airport == airport)
].reset_index(drop=True)
now_submission_format
A fast way to get the latest ETD for a bunch of flights is to use pandas.DataFrame.groupby to group by GUFI, then take the last estimate for each flight (making sure we've sorted ETD by timestamp).
etd.sort_values("timestamp", inplace=True)
now_etd = etd.loc[
    (etd.timestamp > row.timestamp - timedelta(hours=30))
    & (etd.timestamp <= row.timestamp)
]
now_etd
latest_now_etd = now_etd.groupby("gufi").last().departure_runway_estimated_time
Finally, we can merge the submission format and latest ETDs on GUFI and generate our predictions for this batch.
departure_runway_estimated_time = now_submission_format.merge(
    latest_now_etd, how="left", on="gufi"
).departure_runway_estimated_time
departure_runway_estimated_time
estimated_pushback = (
    (departure_runway_estimated_time - now_submission_format.timestamp).dt.total_seconds()
    / 60
) - 15
Since subtracting 15 minutes could put us in a situation where we are predicting a pushback time before the prediction time, we can clip our predictions to never be negative. We'll also cast the predictions to integer as required by the submission format.
estimated_pushback = estimated_pushback.clip(lower=0).astype(int)
estimated_pushback
Now let's wrap that all up in a function that takes a timestamp as input and outputs all of the predictions at an airport for that timestamp.
def estimate_pushback(now: pd.Timestamp) -> pd.Series:
    # subset submission format to the current prediction time
    now_submission_format = airport_submission_format.loc[
        airport_submission_format.timestamp == now
    ].reset_index(drop=True)

    # filter features to 30 hours before prediction time to prediction time
    now_etd = etd.loc[
        (etd.timestamp > now - timedelta(hours=30)) & (etd.timestamp <= now)
    ]

    # get the latest ETD for each flight
    latest_now_etd = now_etd.groupby("gufi").last().departure_runway_estimated_time

    # merge the latest ETD with the flights we are predicting
    departure_runway_estimated_time = now_submission_format.merge(
        latest_now_etd, how="left", on="gufi"
    ).departure_runway_estimated_time

    now_prediction = now_submission_format.copy()

    now_prediction["minutes_until_pushback"] = (
        (
            departure_runway_estimated_time - now_submission_format.timestamp
        ).dt.total_seconds()
        / 60
    ) - 15

    return now_prediction
We'll use tqdm.contrib.concurrent.process_map to parallelize the function and show a helpful progress bar.
from tqdm import tqdm
from tqdm.contrib.concurrent import process_map
airport_submission_format = submission_format.loc[submission_format.airport == airport]
predictions = process_map(
    estimate_pushback,
    pd.to_datetime(airport_submission_format.timestamp.unique()),
    chunksize=10,
)

pd.concat(predictions, ignore_index=True)
That's all of the predictions for KATL in about 2 minutes!
Now let's iterate over all the airports and generate predictions. We'll save individual airport predictions out and concatenate them together as a final step.
for airport in airports:
    print(f"Processing {airport}")
    airport_predictions_path = Path(f"validation_predictions_{airport}.csv.bz2")
    if airport_predictions_path.exists():
        print(f"Predictions for {airport} already exist.")
        continue

    # subset submission format to current airport
    airport_submission_format = submission_format.loc[
        submission_format.airport == airport
    ]

    # load airport's ETD data and sort by timestamp
    etd = pd.read_csv(
        DATA_DIRECTORY / airport / f"{airport}_etd.csv.bz2",
        parse_dates=["departure_runway_estimated_time", "timestamp"],
    ).sort_values("timestamp")

    # process all prediction times in parallel
    predictions = process_map(
        estimate_pushback,
        pd.to_datetime(airport_submission_format.timestamp.unique()),
        chunksize=20,
    )

    # concatenate individual prediction times to a single dataframe
    predictions = pd.concat(predictions, ignore_index=True)
    predictions["minutes_until_pushback"] = predictions.minutes_until_pushback.clip(
        lower=0
    ).astype(int)

    # reindex the predictions to match the expected ordering in the submission format
    predictions = (
        predictions.set_index(["gufi", "timestamp", "airport"])
        .loc[airport_submission_format.set_index(["gufi", "timestamp", "airport"]).index]
        .reset_index()
    )

    # save the predictions for the current airport
    predictions.to_csv(airport_predictions_path, index=False)
predictions = []

for airport in airports:
    airport_predictions_path = Path(f"validation_predictions_{airport}.csv.bz2")
    predictions.append(pd.read_csv(airport_predictions_path, parse_dates=["timestamp"]))

predictions = pd.concat(predictions, ignore_index=True)
predictions["minutes_until_pushback"] = predictions.minutes_until_pushback.astype(int)
with pd.option_context("float_format", "{:.2f}".format):
    display(predictions.minutes_until_pushback.describe())
Most of the predictions fall between 0 and 70 minutes. The peak at 0 is due to a number of negative predictions that we set to 0.
fig, ax = plt.subplots(figsize=(6, 4), dpi=150)
predictions.minutes_until_pushback.clip(lower=0, upper=200).hist(
    bins=np.arange(0, 200), ax=ax
)
ax.set_title("Distribution of predicted minutes to pushback")
ax.set_ylabel("Number of predictions")
ax.set_xlabel("Minutes to pushback")
_ = plt.show()

It is a good idea to do a few final checks to make sure our prediction conforms to the proper submission format. The platform will reject submissions that do not match the provided submission format, but it's nice to check locally just to be sure.
assert (predictions.columns == submission_format.columns).all()
assert len(predictions) == len(submission_format)
assert predictions[["gufi", "timestamp", "airport"]].equals(
    submission_format[["gufi", "timestamp", "airport"]]
)
Submit predictions to the Open Arena
Finally we can load up all of the individual airport predictions, concatenate them, and submit them to the Open Arena for scoring!
We highly recommend saving your submission as a zipped CSV to drastically reduce the file size and upload time. pandas.to_csv can do this automatically if you give it a file path with the .zip extension.
predictions.to_csv("validation_predictions.zip", index=False)
Code submissions in the Prescreened Arena
In the Prescreened Arena, rather than submit predictions themselves, you'll submit your trained model and inference code, and we will compute predictions in our code execution environment.
The runtime repository has a ton of information including code examples you can use when constructing your own code submission, instructions for how to test your submission locally, and much more. For now, we'll simply show how to turn the Fuser ETD baseline solution into a valid code submission.
A code submission must include solution.py that implements two functions:
load_modelthat returns any model assets that are needed for prediction. This solution does not have any model assets, so the function can just returnNone.predictthat takes the features as inputs and outputs predictions for a set of flights at a single prediction time.
The code execution environment does a lot of the work for you: it loads the features, and subsets them to the valid time ranges for each prediction time. All you need to do is provide a function predict that takes as input:
- A set of feature dataframes: These are already filtered to only the valid time range from 30 hours before the prediction time up until the prediction time. You can use these features without restriction to generate your prediction.
- A "partial submission format": A subset of rows from the full submission format corresponding to all of the flights at a single prediction time for one airport.
- Model assets: Whatever your
load_modelfunction returns, most likely your trained model.
and outputs predictions for all the flights in the partial submission format.
Now we'll show how to turn the Fuser ETD benchmark into a valid code submission.
"""Solution for the NASA Pushback to the Future competition."""
from pathlib import Path
from typing import Any

from loguru import logger
import pandas as pd


def load_model(solution_directory: Path) -> Any:
    """Load any model assets from disk."""
    return


def predict(
    config: pd.DataFrame,
    etd: pd.DataFrame,
    first_position: pd.DataFrame,
    lamp: pd.DataFrame,
    mfs: pd.DataFrame,
    runways: pd.DataFrame,
    standtimes: pd.DataFrame,
    tbfm: pd.DataFrame,
    tfm: pd.DataFrame,
    airport: str,
    prediction_time: pd.Timestamp,
    partial_submission_format: pd.DataFrame,
    model: Any,
    solution_directory: Path,
) -> pd.DataFrame:
    """Make predictions for the a set of flights at a single airport and prediction time."""
    logger.info("Computing prediction based on Fuser ETD")

    latest_etd = (
        etd.sort_values("timestamp")
        .groupby("gufi")
        .last()
        .departure_runway_estimated_time
    )
    departure_runway_estimated_time = partial_submission_format.merge(
        latest_etd, how="left", on="gufi"
    ).departure_runway_estimated_time

    prediction = partial_submission_format.copy()
    prediction["minutes_until_pushback"] = (
        (
            departure_runway_estimated_time - partial_submission_format.timestamp
        ).dt.total_seconds()
        / 60
    ) - 15

    prediction["minutes_until_pushback"] = prediction.minutes_until_pushback.clip(
        lower=0
    ).fillna(30)

    return prediction
!zip solution.zip solution.py
Now we have a submission that we can upload to the Prescreened Arena (provided that you've already been prescreened)!
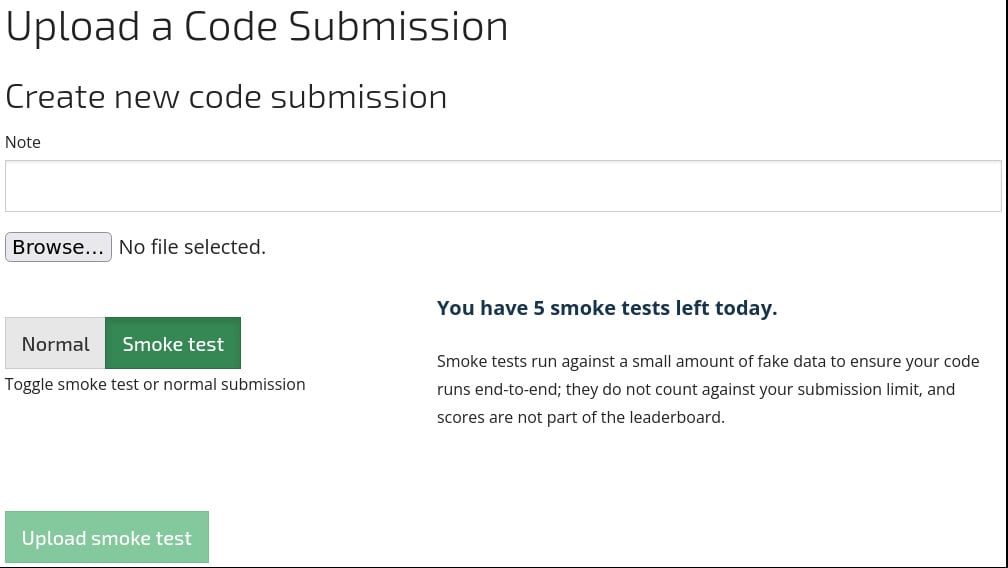
Since it can take several hours to run the submission on the full test data, it's a good idea to first submit a "smoke test" version, which runs on a few hours of data from the training set. Smoke tests are only for helping quickly debug your submission, and scores on the smoke test are not counted in the leaderboard.
Once the smoke test has completed successfully, go ahead and submit your solution for evaluation on the full test set.
Even this simple solution takes about 5 hours to run, so you should definitely consider ways to optimize how your solution processes features and performs inference.
That concludes our benchmark! Head over to the competition home page to get started building your own solution. We're looking forward to seeing what you come up with!